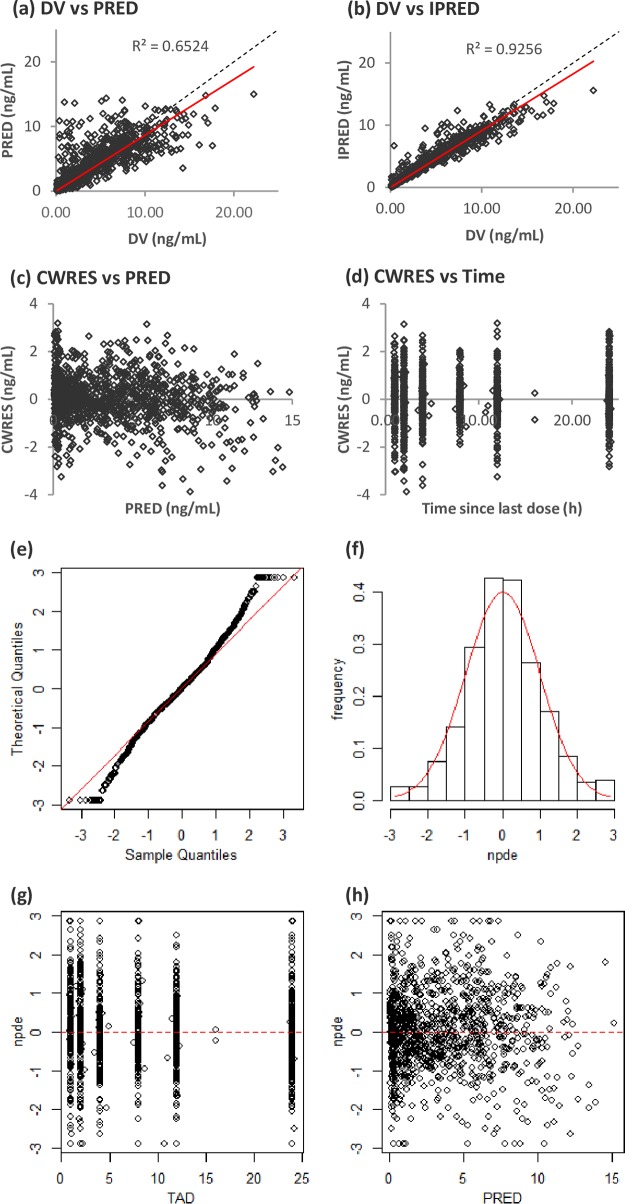
FIG 1.
(a to d) Population predicted concentrations (PRED) versus observed concentrations (DV) (a), individual predicted concentrations (IPRED) versus DV (b), conditional weight residual concentrations (CWRES) versus PRED (c), and CWRES versus time since last dose (d). The dashed lines represent the lines of identity, and the solid red lines represent the linear regression lines. (e to h) QQ (quantile-quantile) plot of the distribution of the normalized prediction distribution errors versus the theoretical distribution, N(0,1) (represented by the red line) (e), histogram of the distribution of NPDE, with the density of the standard Gaussian distribution overlaid represented by the red line (f), plot of NPDE versus time (TAD, time after last dose) (g), and plot of NPDE versus PRED (h).

