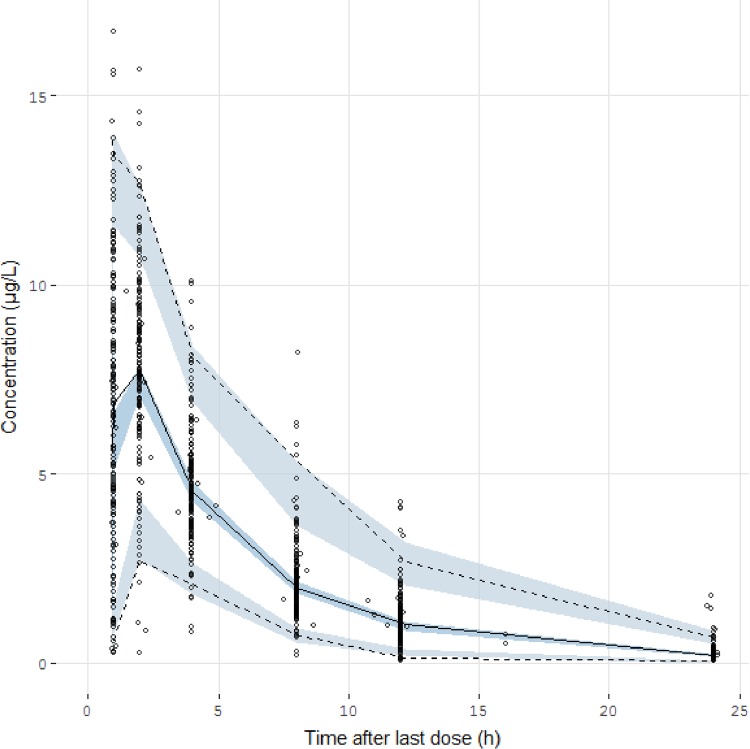
FIG 2.
Prediction-corrected visual predictive check of the final model describing the pharmacokinetics of valganciclovir in children. The circles represent the prediction-corrected observed concentrations. The solid line represents the median of the prediction-corrected observed concentrations, and the semitransparent blue field represents the simulation-based 95% confidence intervals for the median. The observed 2.5th and 97.5th percentiles are indicated by dashed lines, and the 95% confidence intervals for the model-predicted percentiles are indicated as corresponding semitransparent blue fields.

