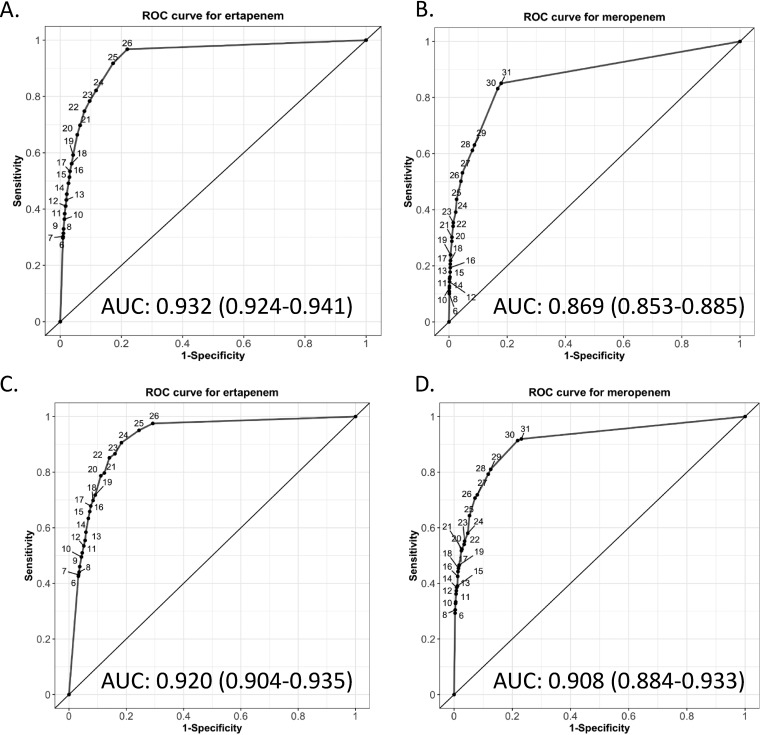
FIG 3.
Receiver operator curves for ertapenem and meropenem zone diameters to detect carbapenem-resistant organisms and carbapenemase-producing organisms by the direct MacConkey plate method. ROC curves for (A) ertapenem and (B) meropenem for detection of carbapenem-resistant organisms (CRO). ROC curves for (C) ertapenem and (D) meropenem for detection of carbapenemase-producing organisms (CPO). The numerical points on the ROC represent different zone diameter readings for the direct MAC cultures. AUC, area under the curve.

