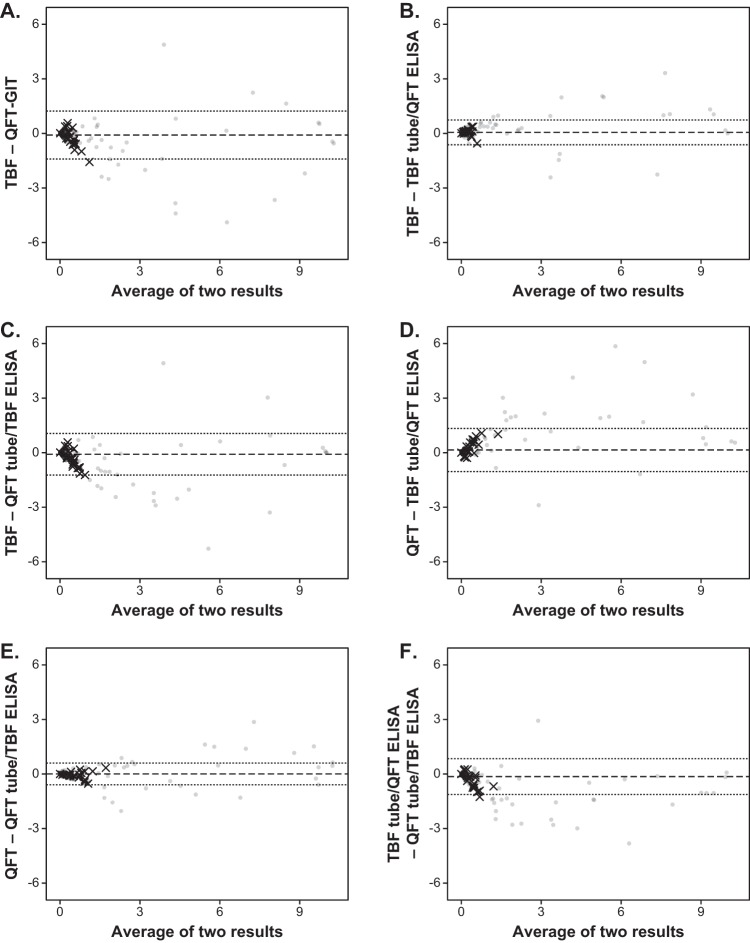
FIG 2.
Bland-Altman plots for the TB antigen-minus-nil values (in international units per milliliter) among the Standard E TB-Feron ELISA (TBF), the QuantiFERON-TB Gold In-Tube assay (QFT-GIT), and the two cross-manner tests (TBF tubes/QFT ELISA and QFT tubes/TBF ELISA). The dashed line and the dotted lines designate the mean value and two standard deviations of the difference between the results of the two assays, respectively. The samples with discordant results between TBF and QFT-GIT are plotted using multiplication signs, and the others are plotted using filled circles.

