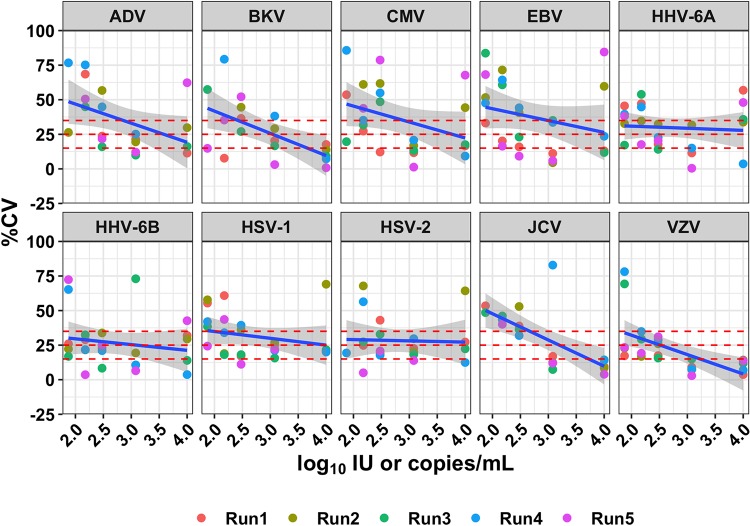
FIG 2.
Interrun precision as a function of concentration. Concentrations are shown in log10 international units or copies per milliliter; % CV was calculated based on the non-log10-transformed values. Points are colored by sequencing run, and the shaded area represents the 95% confidence interval. Dashed horizontal lines indicate commonly used acceptance thresholds for LoD and LLoQ in PCR-based assays (15 and 25% CV, respectively) and the LLoQ for this assay (35% CV).

