Figure 2.
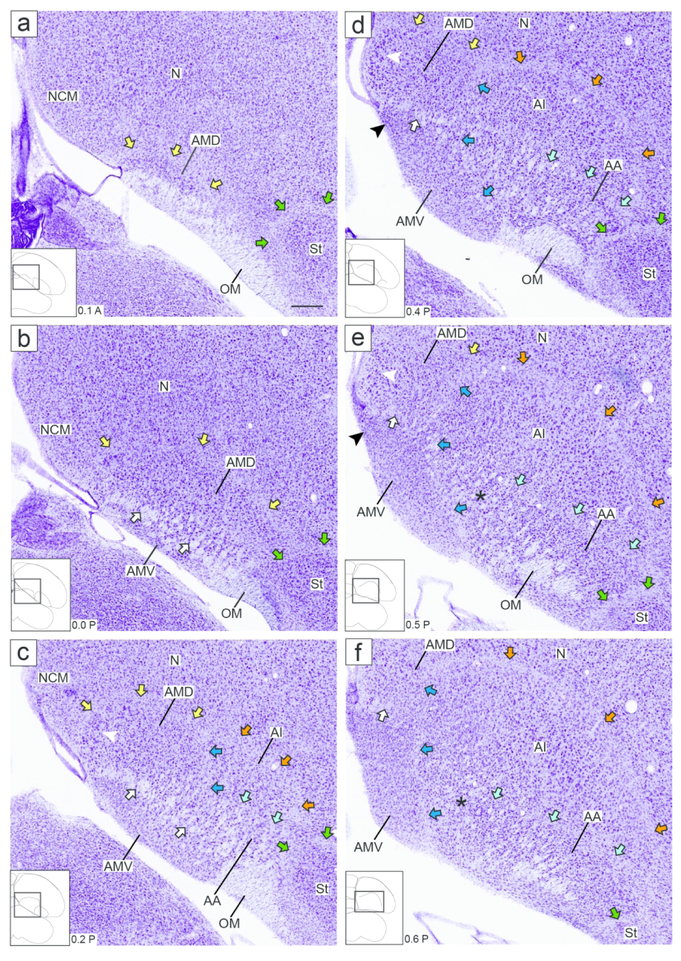
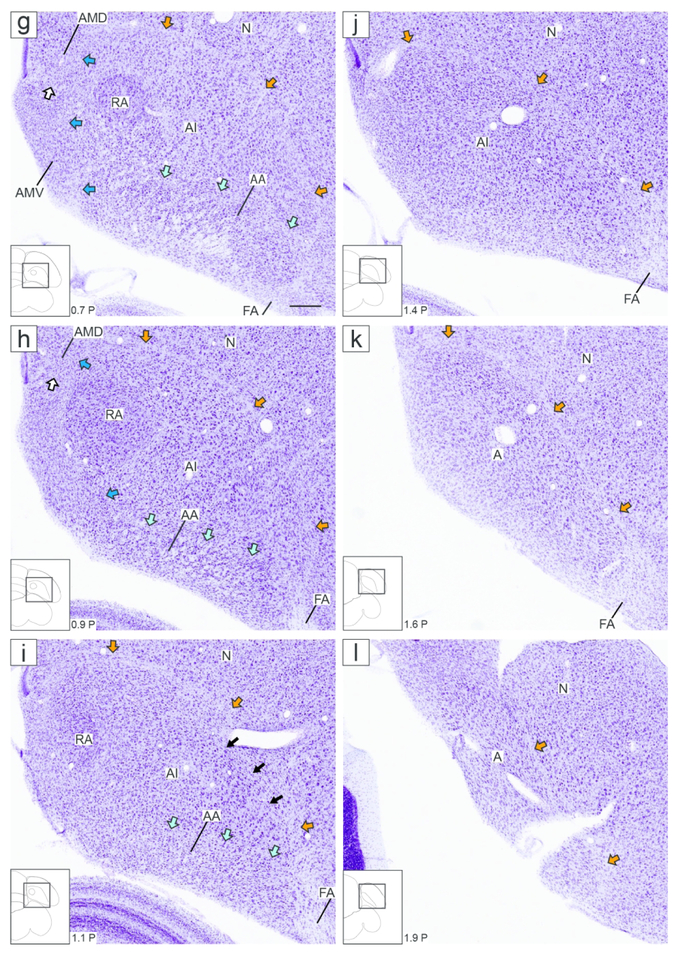
Zebra finch arcopallium on Nissl-stained transverse sections. The images (from Karten et al., 2013) depict the arcopallium and major neighboring structures, with boundaries, internal laminae and cytoarchitectonic domains indicated. The small rectangles in the drawings on the lower left indicate the locations of the areas shown in the images, and the coordinates (in mm) indicate the position of the images along the A-P axis relative to the stereotaxic zero (see also Fig. 1, in orange). Yellow arrows: mLAD; orange arrows: lLAD; green arrows: LPS; white arrows: mOM fiber bundles; dark blue arrows: LAV; light blue arrows: LAO; white arrowhead in (c-e): medial part of AMD with large, darkly staining cells; black arrowhead in (d-e): medial part of AMV with small, tightly packed cells; asterisks in (e-f): medial part of AA rich in fiber bundles; black arrows in (i): dorso-lateral part of AI with darkly staining large cells. For abbreviations, see list. Scale: 250 μm.


