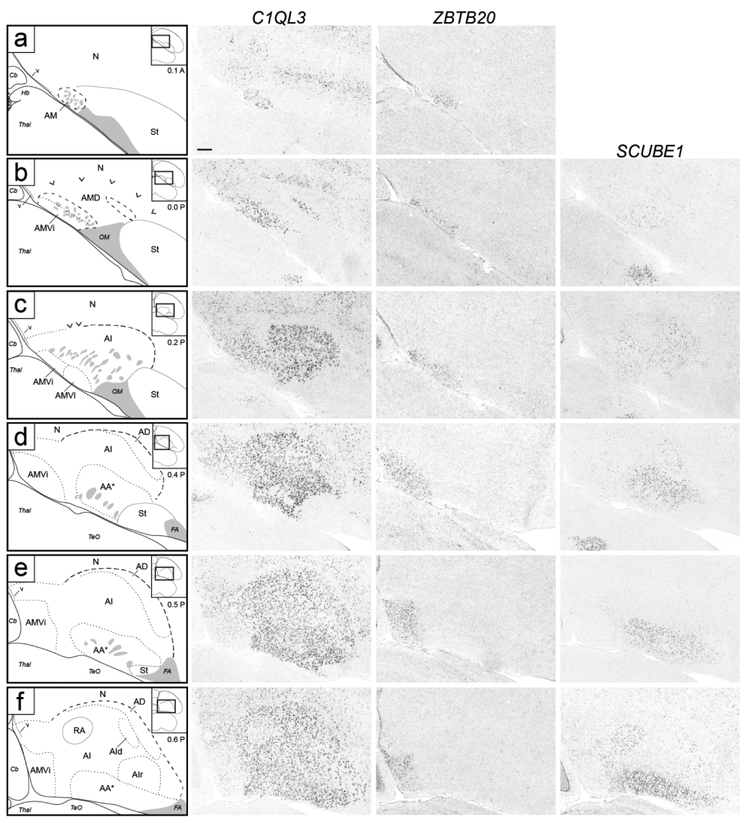
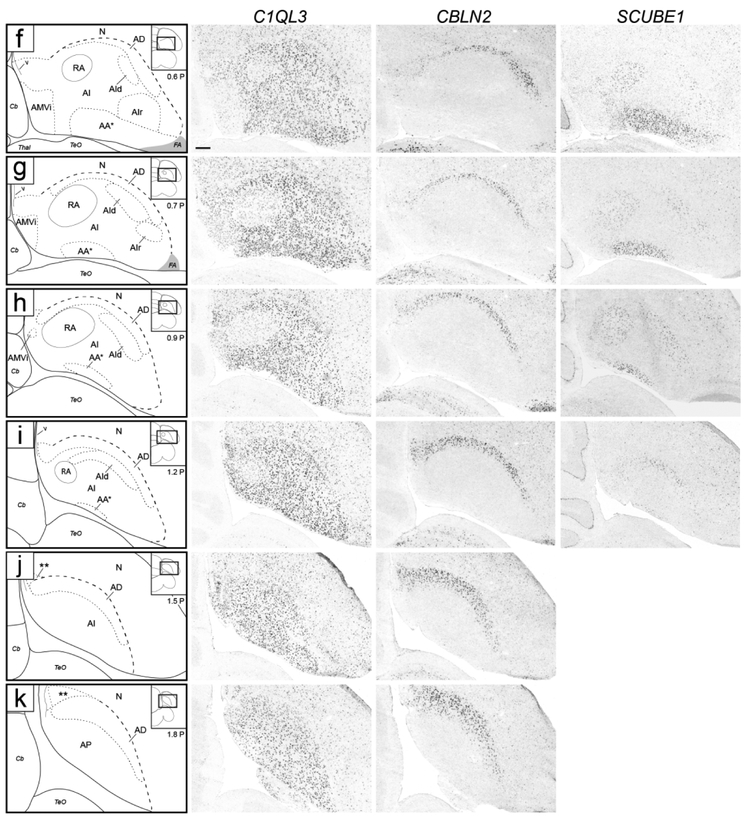
Figure 4.
Molecular definition of arcopallial boundaries and major domains on transverse sections. Shown are in situ hybridization images for a general arcopallium marker (C1QL3) and for markers of arcopallial divisions AMV (subdomains AMVi and AMVl; ZBTB20), AD (CBLN2), and AA*, RA and AId (SCUBE1). ZBTB20 is only shown for rostral levels (a-f), CBLN2 is only shown for caudal levels (f-k), and level (f) is repeated for ZBTB20 and SCUBE1. Left column: drawings depicting the structures shown on the in situ images. Solid lines represent tissue borders; dashed lines represent gene expression boundaries drawn after alignment and superposition of in situ images from adjacent sections (thick dashes: dorsal C1QL3 boundary; small dashes: internal domains based on boundaries of expression for regional markers, and medial dorsal border of low C1QL3 expression). Carets in (b-c) depict the dorsal border of the rostral arcopallium that is devoid of C1QL3 expression, grey patches indicate fiber bundles, double asterisks in (j-k) indicate small caudal nucleus of low C1QL3 and high CBLN2 expression. The small rectangles in the drawings on the upper right indicate the locations of the areas shown relative to reference sections, coordinates (in mm) indicate the position along the A-P axis relative to the stereotaxic zero (for full range of sections, see Fig. 1, in orange). For abbreviations, see list. Scale: 250 μm.


