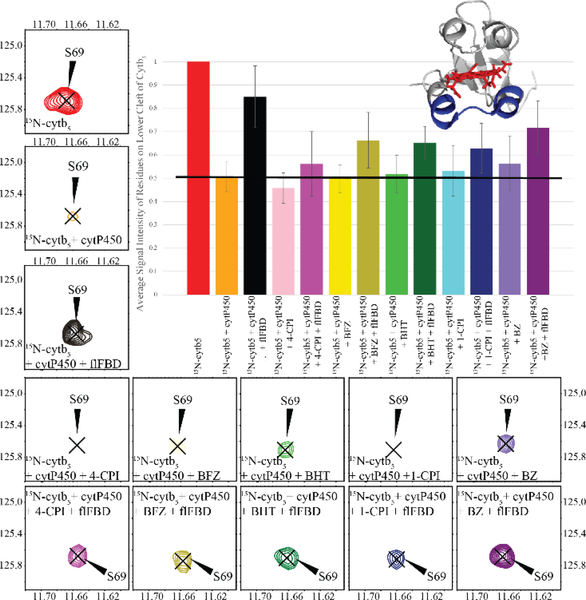
Figure 2: 15N-cytb5 monitored ternary complex formation in nanodiscs.
Average signal intensity of cytb5 residues involved in binding to cytP450 (N62-R73) measured from TROSY-HSQC spectra.[28] Each bar in the graph as well as the contour peak in a 2D TROSY-HSQC spectrum corresponds to the addition of a protein or drug to the NDs containing 15N-labeled cytb5 sample. Peak intensity observed from nanodiscs containing 15N-labeled cytb5 alone was used as the reference (red) and set to 100%. The peak intensities were greatly reduced when cytP450 was added to the cytb5 in ND (orange). After flFBD was incorporated into the ND containing cytb5 and cytP450 (black), signal intensities were partially restored. Signal intensity depicting the effect of each of the five drugs is represented in the lighter shade bar and the darker shade bars are the measurement after the addition of flFBD to the substrate bound-cytb5-cytP450 complex: 4-CPI (pink); BFZ (yellow); BHT (green); 1-CPI (blue); BZ (purple). The average signal intensity represented by the black horizontal line. (inset) The lower cleft residues are highlighted in blue on a structure of cytb5 (PDB 2M33). Error bars were generated from the standard deviation of the average signal intensities of the mentioned residues.

