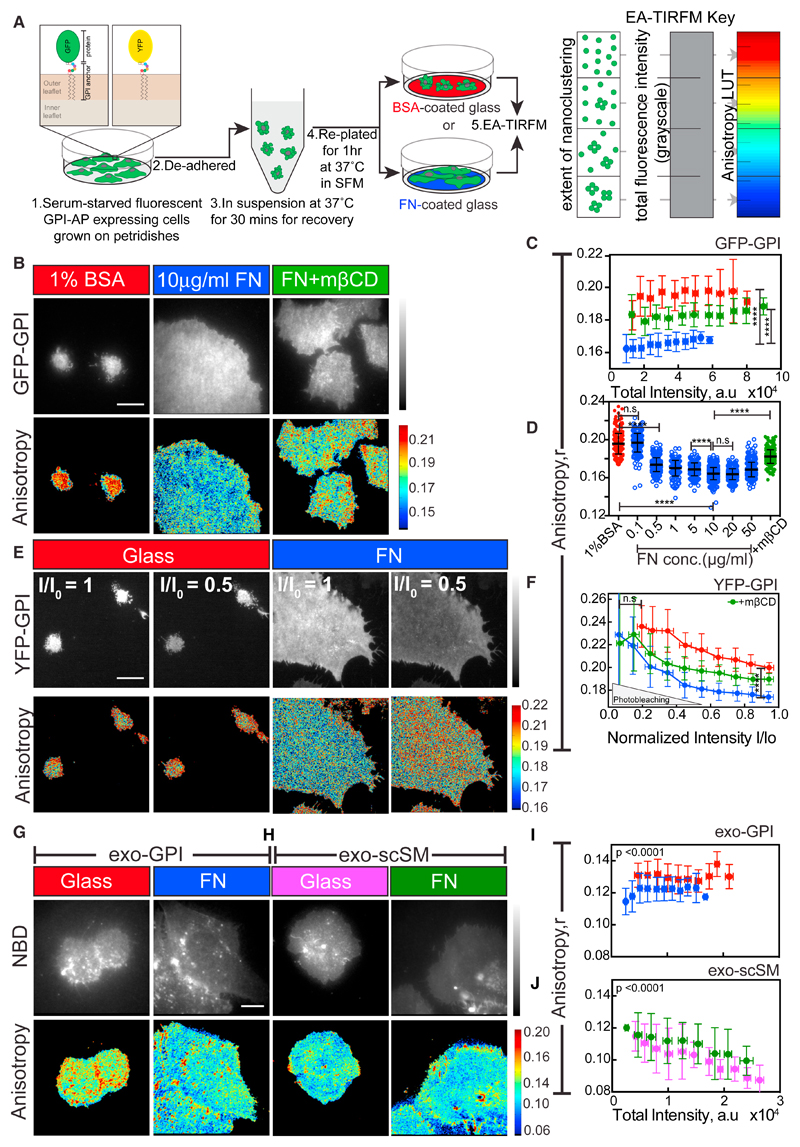
Figure 1. Activation of Fibronectin Binding Integrins Leads to Enhanced Nanoclustering of GPI-APs in Living Cells.
(A) Left: experimental schema: GPI-AP-transfected cells were de-adhered and re-plated on glass coverslips with the indicated coatings in serum-free media (SFM). The inset shows GFP or YFP-GPI at the outer leaflet of the PM. Right: in the absence of other contributing factors, the change in anisotropy value of fluorescently tagged GPI-APs reports on the extent of homoFRET due to the proximity of like fluorophores detected using an emission anisotropy TIRF microscope (EA-TIRFM). By convention, anisotropy maps are color coded, with low (or high) anisotropy denoted by blue (or red) pixels that correspond to regions enriched (or depleted) in nanoclusters. Representative intensity and steady-state anisotropy images are shown (B, E, G, and H).
(B–D) GFP-GPI-expressing cells re-plated for 1 h on glass coverslips coated with 1% BSA (red) or 10 μg/mL FN before (blue) or after treatment with 10 mM mβCD for 45 min (green) (B). Graphs show plots of mean anisotropy at various total intensity bins (C) and scatter dot plots with mean anisotropy values (D) of regions of interest (ROIs) obtained from cells plated on BSA-glass (red) or indicated concentrations of FN before (blue) or after treatment with mβCD (green). Note: GPI anisotropy data are represented as scatter dot plots, when fluorescence emission anisotropy is independent of its total intensity.
(E and F) YFP-GPI-expressing CHO cells plated on glass (red) or FN before (blue) (E) or after treatment with mβCD (green) and corresponding anisotropy versus relative intensity (I/Io) plots (F) during photobleaching.
(G–J) CHO cells labeled with the GPI-analog NBD-GPI (exo-GPI: exogenous GPI; G) or C6NBD-sphingomyelin (exo-scSM; H) and re-plated on glass (red, magenta) or on FN (blue, green). Plots in (I) and (J) show mean anisotropy at various total intensity bins. Note that, unlike exo-GPI, the exo-scSM exhibited a concentration-dependent anisotropy with lower anisotropy on glass.
Scale bar, 10 μm in all panels. All the error bars represent SD. Not significant (n.s.) p > 0.05, *p ≤ 0.05, **p ≤ 0.01, ***p ≤ 0.001, ****p ≤ 0.0001. Sample size and p values are provided in Table S4.
See also Figure S1.

