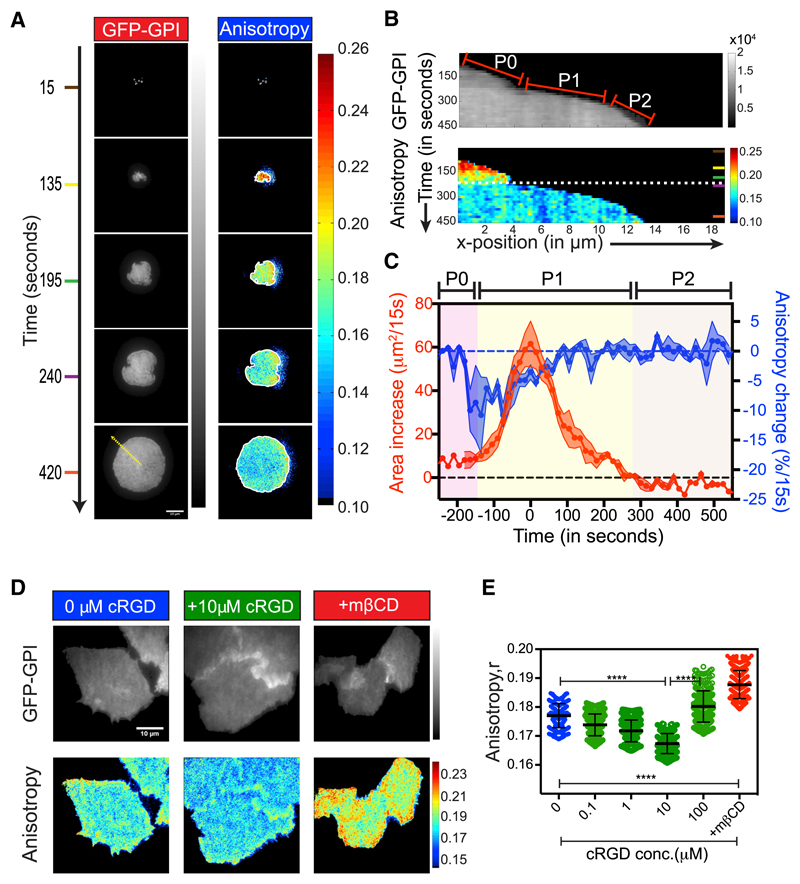
Figure 2. Activation of RGD Binding Integrins Leads to Enhanced Nanoclustering of GPI-APs during the Early Stages of Cell Spreading.
(A) Representative intensity and steady-state anisotropy images of GFP-GPI-expressing CHO cells at the indicated times post-settling on FN.
(B) Kymograph shows the time trace of GPI intensity (top) and anisotropy (bottom) of a 3 pixel line (ROI) drawn perpendicular to the cell edge (yellow line in A) exhibiting cell-spreading phases (red lines in top panel); P0–P1 transition (dashed white line in bottom panel) is shown.
(C) Graph shows the change in the whole cell area (red curve; left y axis) and the corresponding normalized GFP-GPI anisotropy change (blue curve; right y axis) between two consecutive frames 15 s apart, plotted as a function of spreading time. The solid white lines in (A) denote the segmented outline of cells used in the graph. Data from 4 cells have been aligned relative to the timing of the peak area change (t = 0 in C). Dots represent the mean for each time bin; shaded region marks the SEM.
(D and E) GFP-GPI-expressing CHO cells grown on glass coverslips and imaged directly (blue) or after incubation (30 min) with indicated concentrations of soluble cRGD (green) either before or after treatment with 10 mM mβCD (red). Scatter dot plot (E) with mean anisotropy values. Note that at high concentrations of cRGD (>100 μM) cell detach due to ligand competition, resulting in higher anisotropy values.
Scale bar, 10 μm in all panels. Error bars represent SD. n.s. p > 0.05, *p ≤ 0.05, **p ≤ 0.01, ***p ≤ 0.001, ****p ≤ 0.0001. Sample size and p values are provided in Table S4.

