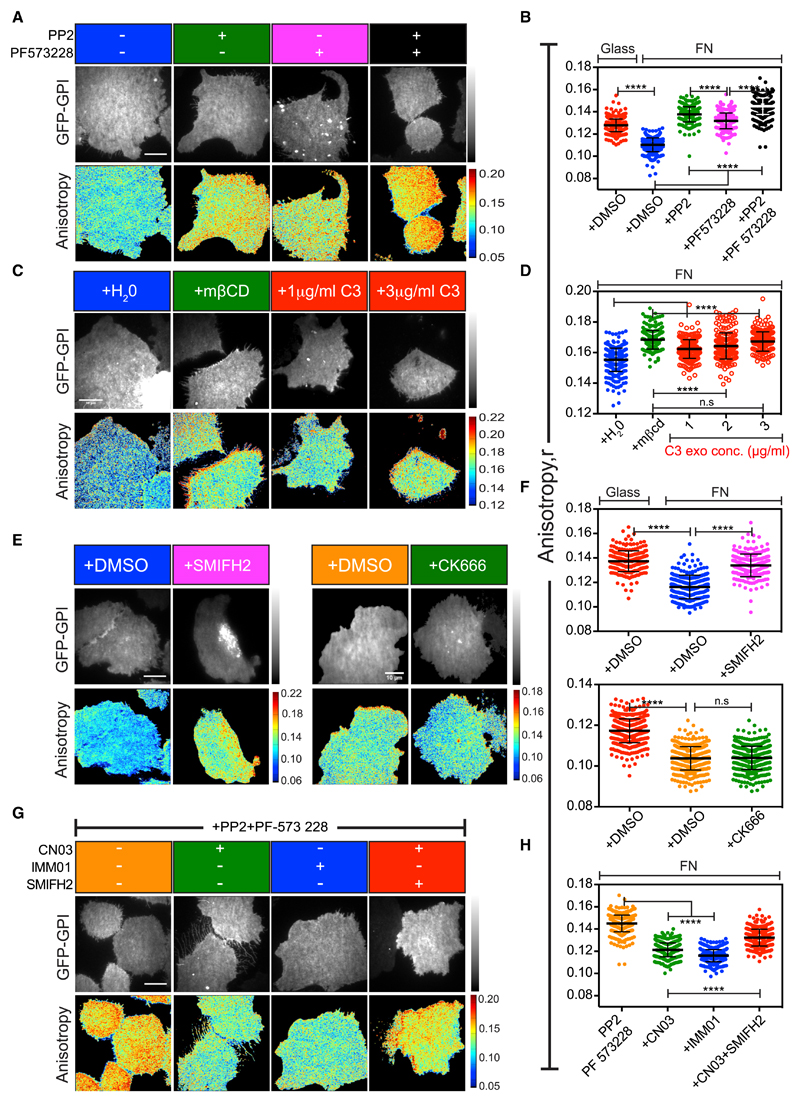
Figure 3. Inhibition of SFK-FAK, RhoGTPase, and Formins Leads to Loss of FN-Triggered Nanoclustering of GPI-APs.
(A–H) Representative intensity and steady-state anisotropy images and scatter dot plots with mean anisotropy values of ROIs obtained from GFP-GPI-expressing CHO cells re-plated on FN and imaged following pre-treatment with the following:
(A and B) DMSO (blue), SFK inhibitor PP2 (20 μM; green), FAK inhibitor PF-573 228 (10 μM; magenta) or both (black);
(C and D) indicated concentrations of RhoA inhibitor exoenzyme C3 transferase (C3 exo; red) or with the vehicle (H2O;blue) or with mβCD (10 mM, green);
(E and F) formin inhibitor SMIFH2 (10 μM, magenta; top in F) or Arp2/3 inhibitors CK666 (100 μM, green, bottom in F) or respective DMSO vehicle control (blue, orange);
(G and H) formin agonist CN03 (1 μg/mL, green) or RhoA activator IMM01 (10 μM, blue) or with RhoA activator and SMIFH2 (red), all in the presence of 20 μM PP2 and 10 μM PF-573 228.
DMSO pre-treated cells on glass is shown in red in (B) and (F). Scale bar, 10 μm in all panels. All error bars represent SD. n.s. p > 0.05, *p ≤ 0.05, **p ≤ 0.01, ***p ≤ 0.001, ****p ≤ 0.0001. Sample size and p values are provided in Table S4.
See also Figure S3.

