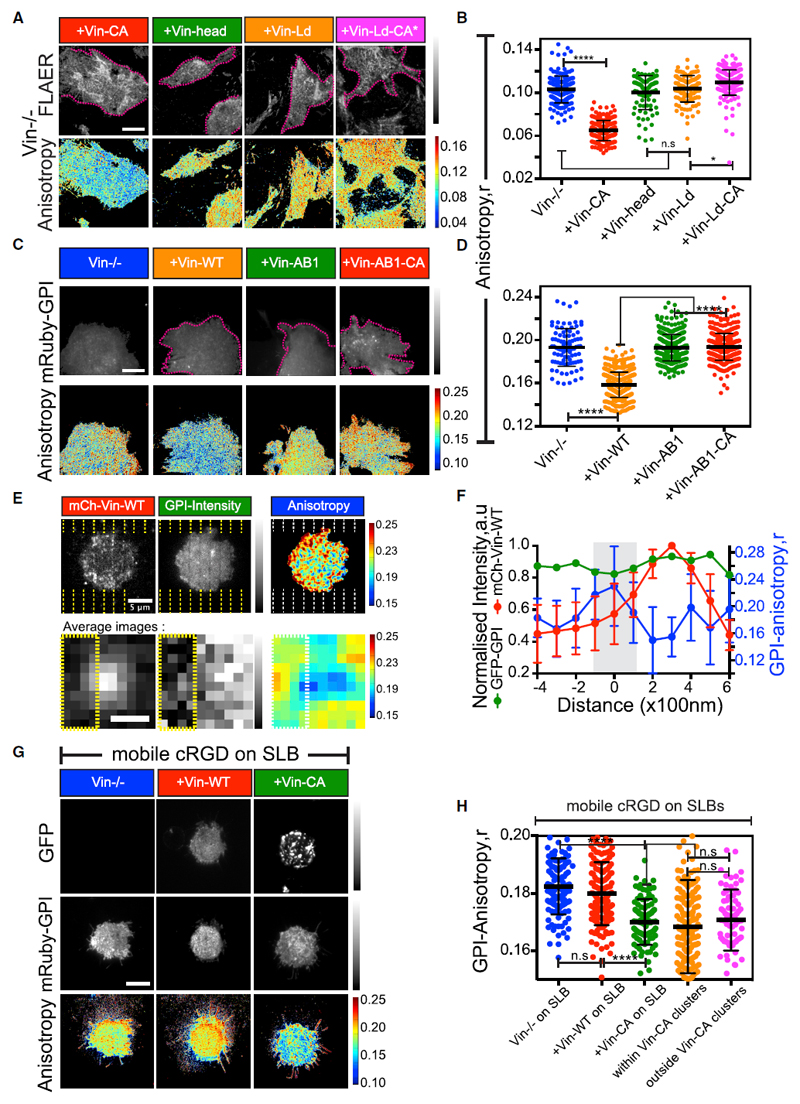
Figure 6. Vinculin Facilitates GPI-AP Nanoclustering in an Integrin Signaling-Dependent Manner.
(A–D) Representative intensity and steady-state anisotropy images and scatter dot plot with mean anisotropy values of ROIs obtained from Alexa-568-FLAER-labeled (A and B) or mRuby2-GPI (C and D)-expressing Vin−/− cells or Vin−/− cells transfected with GFP variants of the indicated vinculin constructs and re-plated on FN prior to imaging. Note: Vin−/−, blue, shows data from Figure 5F, and dotted magenta lines in (A) and (C) outline the transfected cells.
(E) CHO cells transfected with mCherry-vinculin (mCh-Vin-WT) and plated on cRGD functionalized SLBs assembled on nanopatterned surfaces. The dashed line represents the location of the chromium line patterns. Bottom panel: average images of vinculin clusters and correlated GPI-intensity normalized to the maximum, alongside corresponding 3-pixel averaged GPI-anisotropy images obtained from 9 independent vinculin clusters.
(F) Line profiles of normalized mCh-Vin-WT mean intensity (red curve; left-y axis in F), normalized mean GFP-GPI-intensity (green curve; left y axis in F), and mean GFP-GPI-anisotropy (blue curve; right y axis in F) obtained from 10 independent line scans drawn perpendicular to the chromium patterns and passing through the Vin-WT cluster-center. Note, the gray-shaded area (in F) and left side of yellow dotted line (in E, bottom) mark the position of the chromium pattern where the dip in GFP-GPI-intensity is observed.
(G and H) mRuby2-GPI expressed in Vin−/− cells alone (blue) or co-transfected with GFP-Vin-WT (red) or GFP-Vin-CA (green) (G) and plated on mobile cRGD functionalized continuous SLBs and quantified from regions obtained within segmented Vin-CA clusters (orange in H) or for ROIs drawn outside such clusters (magenta in H). Note the diffuse versus clustered distribution of Vin-WT and Vin-CA, respectively, indicating insufficient activation of Vin-WT on continuous SLBs. Scale bar, 10 μm in (A), (C), and (G) and 5 μm (E, top) and 500 nm (E, bottom). All error bars represent SD. n.s. p > 0.05, *p ≤ 0.05, **p ≤ 0.01, ***p ≤ 0.001, ****p ≤ 0.0001. Sample size and p values are provided in Table S4.
See also Figure S6.

