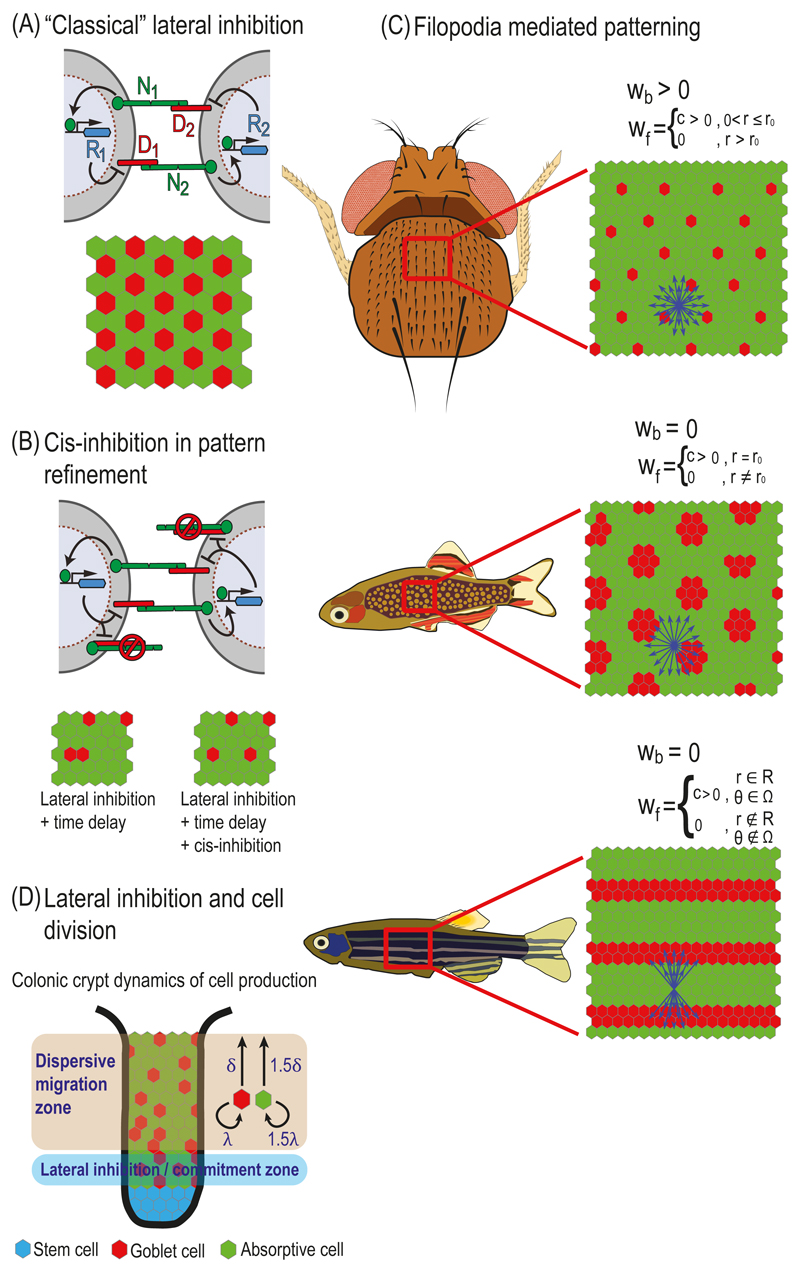
Fig. 5.1. Models of lateral inhibition.
(A) "Classical" lateral inhibition. Top – Schematic representation of a lateral inhibition circuit in two cells. In this circuit NOTCH signaling in each cell is generated by the interactions between NOTCH receptors (N1 and N2) and NOTCH ligands (D1 and D2). NoTCH signaling in each cell activates a repressor (R1 and R2) that downregulates the expression or activity of DELTA in that cell. Bottom – A typical simulation result on a hexagonal lattice of cells. Simulation starting with uniform initial conditions (plus noise) results in a salt-and-pepper like pattern where each high DELTA cell (red) is surrounded by low DELTA cells (green). (B) Cis-inhibition in pattern refinement. Top – Schematic representation of a lateral inhibition model that includes cis-inhibition between receptors and ligands. In the cis-inhibition model, a ligand on one cell binds to a receptor on the same cell leading to the formation of an inactive complex. These cell-autonomous interactions reduce the number of free ligands and receptors on the cell surface. Bottom – Cis-inhibition reduces the probability of defects (two neighboring red cells) for models of lateral inhibition that include time delays in the intracellular regulatory feedback. (C) Filopodia mediated patterning. Schematic of models that take into account long range NOTCH signaling mediated by filopodia. By controlling the relative weights of signaling through cell-cell body contacts, wb, and filopodial contacts, wf, a variety of patterns can be formed. Top – A model where signaling is mediated by both filopodia and cell body contacts. In this model filopodia are extended uniformly up to a radius r0 from the center of the cell (blue arrows). This model corresponds to the large spacing pattern of bristles on the Drosophila notum. Middle – A model where NOTCH signaling is mediated only through filopodia and not through cell body contacts. Here, the filopodia extends only to cells that are at radius r0 from the center of the cell. This model can produce a spotted pattern similar to the one observed in the skin of pearl danio fish. Bottom – A model where NOTCH signaling is limited to filopodia which are restricted to a radius range R and angular range Ω. Such a model can produce a striped pattern similar to the one observed in the zebrafish skin. (D) Lateral inhibition and cell division. A schematic model describing differentiation dynamics in the colonic crypt. Stem cells at the bottom of the crypt (blue) are differentiated into Goblet cells (red, high DELTA) and absorptive cells (green, low DELTA), which migrate towards the top of the crypt (the lumen). Stem cells divide at the bottom of the crypt (stem cells layer), causing an upward movement of the entire lattice. Lateral inhibition occurs at the layer adjacent to the stem cells layer (lateral inhibition zone or commitment zone). At this layer, cell fates are determined by the lateral inhibition process as described in (A). Once differentiated, the cells migrate from the commitment zone to the dispersive migration zone. In this zone, Goblet cells divide at a lower rate (λ) and migrate at a lower speed (δ) compared to absorptive cells (1.5λ and 1.5δ). The differences in division rates and migration speed result in a spaced salt-and-pepper like pattern in the lumen.

