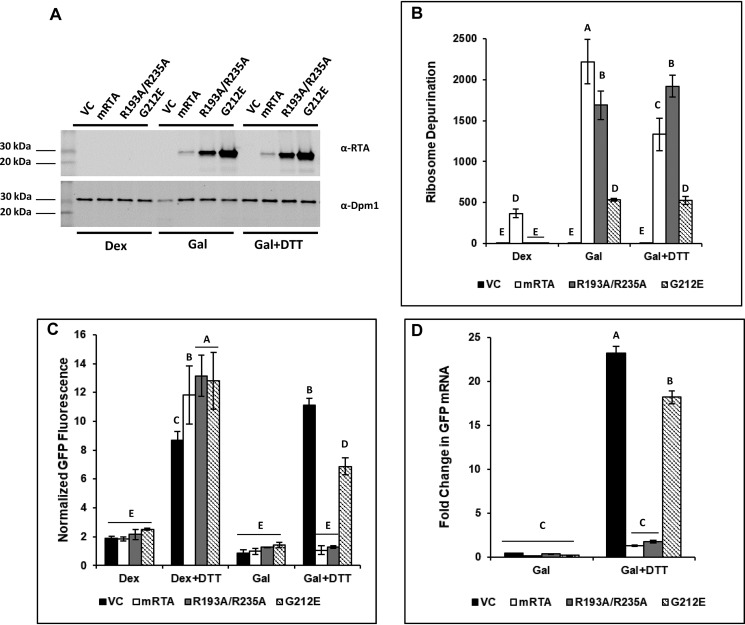
Figure 1.
Depurination of rRNA correlates with inhibition of the UPR in yeast expressing RTA mutants during ER stress. Yeast transformed with VC, WT (mRTA), or mutant RTA expression plasmids were grown in dextrose or galactose for 6 h to induce RTA expression, followed by an additional 90-min growth in the absence or presence of 2 mm DTT to induce ER stress. Aliquots were taken to prepare protein lysates for Western blotting or flow cytometry analysis and total RNA for qRT-PCR analysis. A, protein prepared from yeast carrying VC, WT, or mutant RTA expression plasmids grown in Dex or Gal or in the presence of ER stress (Gal + DTT) was subjected to Western blot analysis with monoclonal antibodies against RTA (top) and Dpm1 (bottom) as a loading control. Uncropped Western blots are shown in Fig. S4. B, ribosome depurination in yeast carrying VC, WT, or mutant RTA expression plasmids quantified by qRT-PCR using total RNA. The y axis shows the average -fold change in ribosome depurination compared with VC, with error bars representing the range of depurination from three biological replicates using three technical replicates for each. Means with different letters show significant differences according to the LSD test (p < 0.01). C, GFP fluorescence from a UPRE-GFP reporter measured by flow cytometry in yeast carrying VC, WT, and mutant RTA expression plasmids grown in dextrose in the absence (Dex) or presence of ER stress (Dex + DTT) and with RTA expression in the absence (Gal) or presence (Gal + DTT) of ER stress. The y axis shows the GFP signal normalized to yeast lacking the UPRE-GFP reporter from a minimum of three biological replicates along with the S.E. (n = 3). Means with different letters show significant differences according to the LSD test (p < 0.01). D, -fold change in GFP mRNA expressed from the UPRE-GFP reporter in yeast carrying VC, WT, or mutant RTA expression plasmids was quantified by qRT-PCR using total RNA prepared from cells grown in dextrose or during RTA expression in the absence (Gal) or presence of ER stress (Gal + DTT). The y axis shows the average -fold change in GFP mRNA compared with the same cells grown in dextrose, with error bars representing the range of GFP expression from two biological replicates using three technical replicates for each. Means with different letters show significant differences according to the LSD test (p < 0.001).

