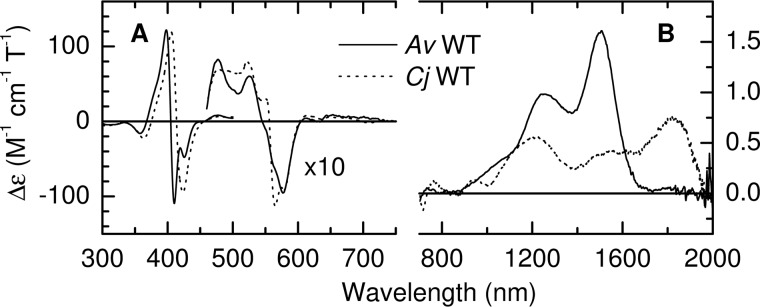
Figure 3.
A and B, the MCD spectra of oxidized A. vinosum (solid line) and C. jejuni (dashed line) TsdA in the ranges (A) 300–750 nm and (B) 700-2000 nm. Protein concentrations were 34 μm (300–500 nm) and 180 μm (460–2000 nm) for AvTsdA and 17 μm (300–530 nm), 176 μm (460–750 nm) and 147 μm (700–2000 nm) for CjTsdA. Data recorded at room temperature in 50 mm HEPES, 50 mm NaCl, pH 7, or the same buffer in D2O pH* 7 for nIR MCD.

