Figure 6.

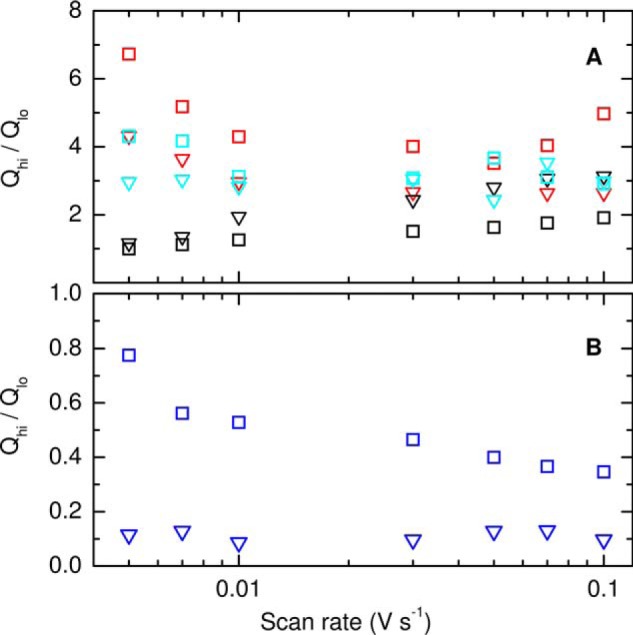
Ratio of moles of electrons transferred in high-potential (Qhi) and low-potential (Qlo) peaks for oxidation (squares) and reduction (triangles): A, CjTsdA (red), CjTsdA C138H (black), CjTsdA N254K (cyan); B, AvTsdA (blue). Data points represent average values from four scans recorded in 50 mm HEPES, 50 mm NaCl, pH 7, 4 °C.
