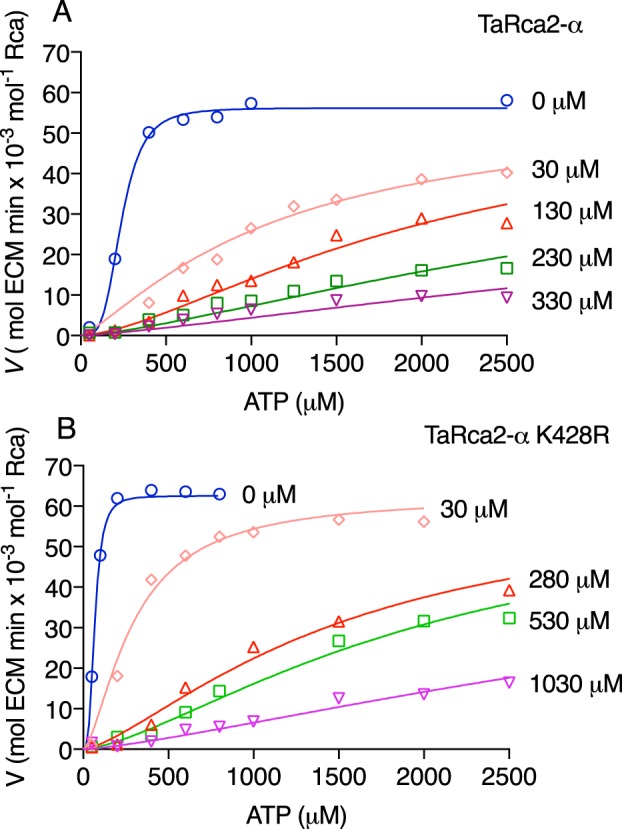
Figure 5.

ATP substrate kinetics at differing ADP inhibitor concentrations for TaRca2-α and the ADP-insensitive K428R substitution. Activation velocities of TaRca2-α WT (A) and the K428R substitution (B) with varying concentrations of ADP inhibitor (I) added as indicated on the right of individual curves. A competitive-inhibition model fitted the data best (global R2 > 0.98 for both variants) using the following equations: Khalf-Obs = Khalfh(1 + I/Ki) and V = Vmax × Sh/(Khalf-Obs + Sh) where Khalf is the ATP substrate corresponding to half-maximal velocity in μm, h is the Hill slope, S is the ATP substrate concentration, and I is the ADP inhibitor concentration in μm. The apparent inhibition binding constant (Ki) was determined to be 4.9 ± 1.5 μm for TaRca2-α and 3.4 ± 1.4 μm for K428R through iteration of the curves.
