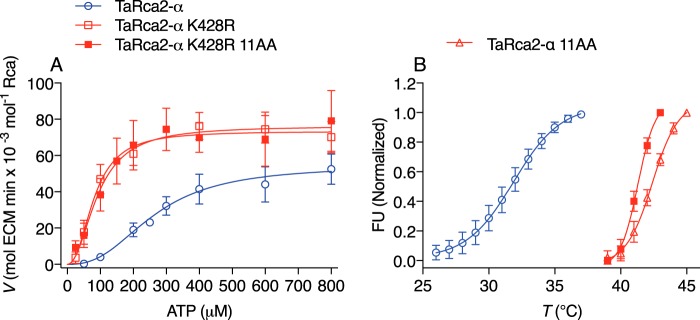
Figure 6.
The interaction of ATP substrate kinetics and thermostability. A, ATP substrate–dependent enzyme kinetic curves of the TaRca2-α WT, K428R substitution, and the K428R substitution combined with 11 residue substitutions (K428R 11AA) corresponding to a recently reported (28) thermostable isoform. B, thermostability profiling using differential scanning fluorimetry of the TaRca2-α WT, the recently reported thermostable isoform (TaRca2-α 11AA), and the combined K428R 11AA variant. FU refers to fluorescent units, and T refers to temperature. The point of inflection of the fluorescence curves corresponds to the thermal midpoint (50% enzymatic activity) and is 31.9 ± 0.2 °C for TaRca2-α WT, 42.4 ± 0.1 °C for the 11-amino acid (AA) thermostable variant, and 41.3 ± 0.1 °C for the combined K428R 11AA variant. Values are the means ± S.D. (error bars) of three experimental replicates.

