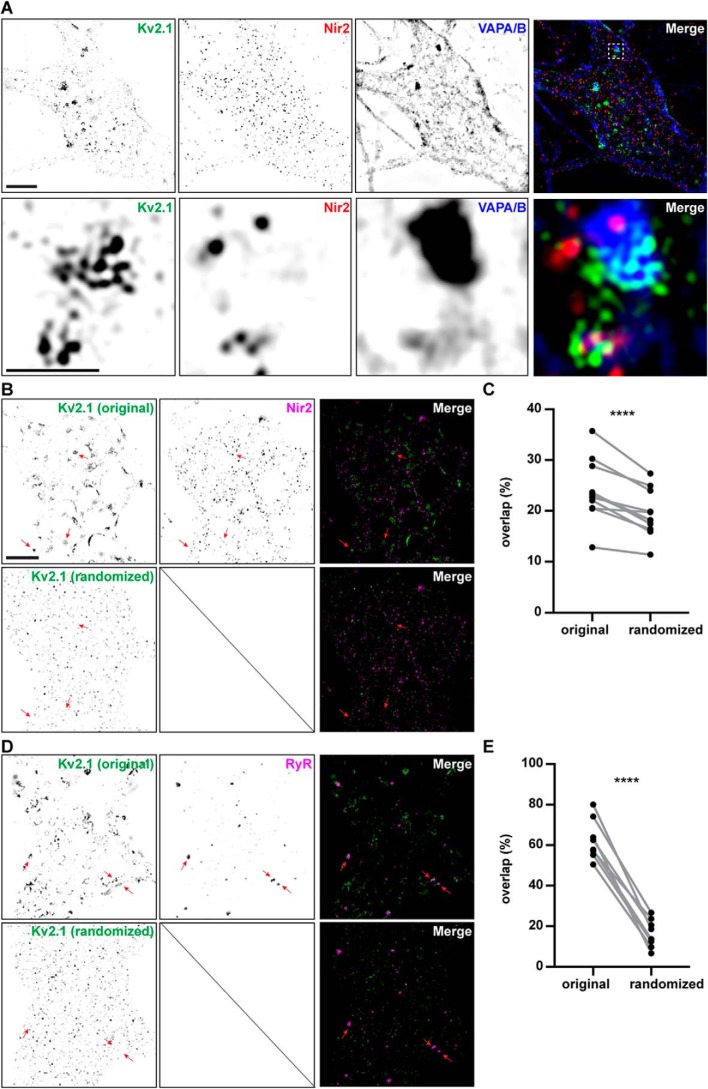
Figure 6.
Spatial distributions of Kv2.1, Nir2, and VAPA/B immunolabeling in cultured hippocampal neurons. A, super-resolution (N-SIM) optical sections taken at the basal membrane of a cultured rat hippocampal neuron immunolabeled for endogenous Kv2.1 (shown in green), Nir2 (shown in red), and VAPA/B (shown in blue). Merged image shown to the right. Bottom panels show magnified selection from merged image in top panel. The scale bar in the upper left Kv2.1 panel is 5 μm and holds for all panels in that row. The scale bar in the magnified Kv2.1 panel is 1.25 μm and holds for all panels in the bottom two rows. B, super-resolution (N-SIM) optical sections taken at the basal membrane of a cultured rat hippocampal neuron immunolabeled for endogenous Kv2.1 and Nir2. The merged image is shown to the right, with Kv2.1 shown in green and Nir2 shown in magenta. The top row shows the original image, and the bottom row the same image after randomization of the Kv2.1 immunolabeling signal. Arrows point at spatially correlated signals in the original images that are lost in the randomized images. The scale bar is 5 μm and also holds for D. C, summary graph of percent overlap of Nir2 signal with Kv2.1 measured from the original images and from the same images after randomization of the Kv2.1 signal (randomized). Percent overlap values for Kv2.1 and Nir2 are original: 23.9 ± 5.97%, and randomized: 19.4 ± 4.56% (mean ± S.D.; ****, p value = 0.000594, n = 11 cells; two-tailed paired t test). D, super-resolution (N-SIM) optical sections taken at the basal membrane of a cultured rat hippocampal neuron immunolabeled for endogenous Kv2.1 and RyRs. The merged image is shown to the right, with Kv2.1 shown in green and RyRs shown in magenta. The top row shows the original image, and the bottom row the same image after randomization of the Kv2.1 immunolabeling signal. Arrows point at spatially correlated signals in the original images that are lost in the randomized images. E, summary graph of percent overlap of RyR signal with Kv2.1 measured from the original images and from the same images after randomization of the Kv2.1 signal (randomized). Percent overlap values for Kv2.1 and RyRs are original: 62.6 ± 9.96%, and randomized: 16.5 ± 7.00% (mean ± S.D.; ****, p value = 0.00000195, n = 8 cells; two-tailed paired t test).

