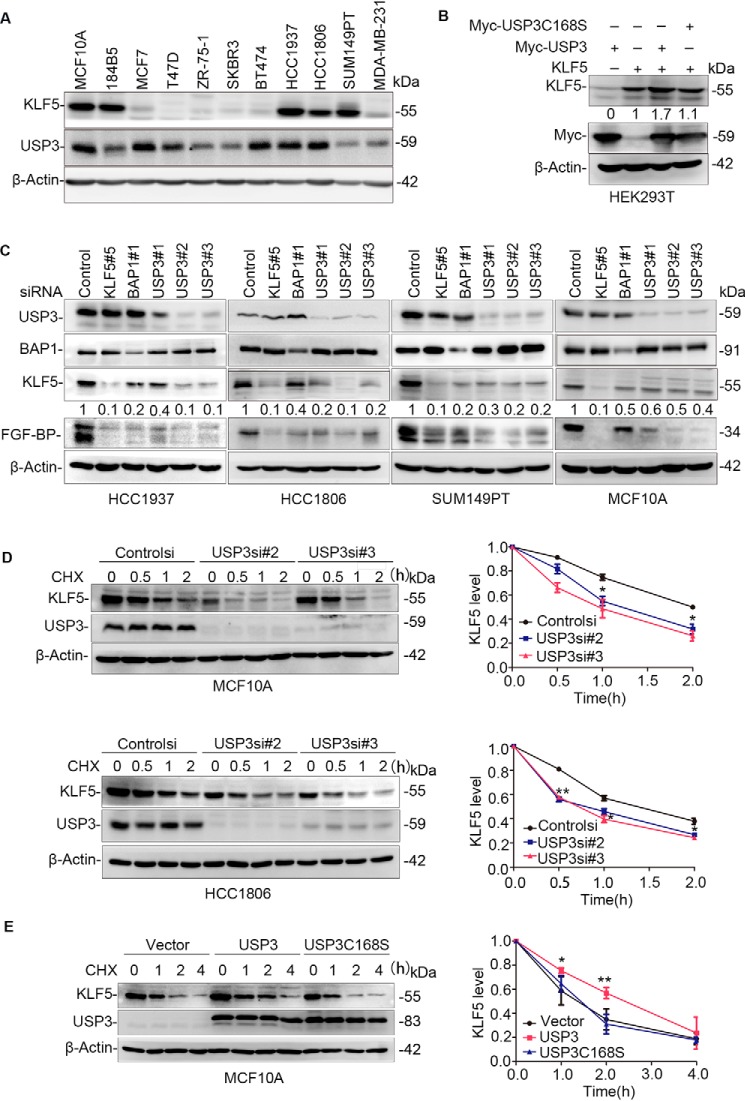
Figure 1.
USP3 stabilizes KLF5. A, KLF5 and USP3 protein expression levels in immortalized mammary epithelial cell lines (MCF10A and 184B5) and nine breast cancer cell lines were examined by WB. The experiment was repeated three times, and a representative result is shown. B, USP3 overexpression stabilized the KLF5 protein in a DUB enzyme activity–dependent manner. KLF5 was co-expressed with USP3 or USP3C168S in HEK293T cells. ImageJ was used to measure the band intensities of KLF5 and β-actin. The normalized KLF5 protein levels are shown below the KLF5 blot. The experiment was repeated three times, and a representative result is shown. C, USP3 knockdown decreased KLF5 and FGF-BP protein levels in breast cancer cell lines (HCC1937, HCC1806, and SUM149PT) and a breast epithelial cell line (MCF10A). The cells were transfected with control or three different USP3 siRNAs for 48 h. Control siRNA was used as the negative control. KLF5 and BAP1 siRNAs were used as the positive controls. WB was used to measure the endogenous KLF5 and FGF-BP protein levels. ImageJ was used to measure the band intensities of KLF5 and β-actin. The normalized KLF5 protein levels are shown below the KLF5 blot. The experiment was repeated three times, and a representative result is shown. D, USP3 knockdown shortened the half-life of KLF5. MCF10A and HCC1806 cells were transfected with siRNA and treated with cycloheximide (CHX) for the indicated time points. WB was used to measure the endogenous KLF5 protein level. The graph on the right shows the quantitative results of KLF5 by ImageJ. Error bars represent S.D. The experiment was repeated three times, and a representative result is shown. *, p < 0.05; **, p < 0.01, t test. E, USP3 overexpression extended the half-life of KLF5 protein. USP3 or USP3 C168S were stably overexpressed in MCF10A cells. WB was used to measure the endogenous KLF5 protein levels after the cells were treated with CHX for the indicated time. The graph on the right shows the quantitative results. Error bars represent S.D. The experiment was repeated three times, and a representative result is shown. *, p < 0.05; **, p < 0.01, t test.

