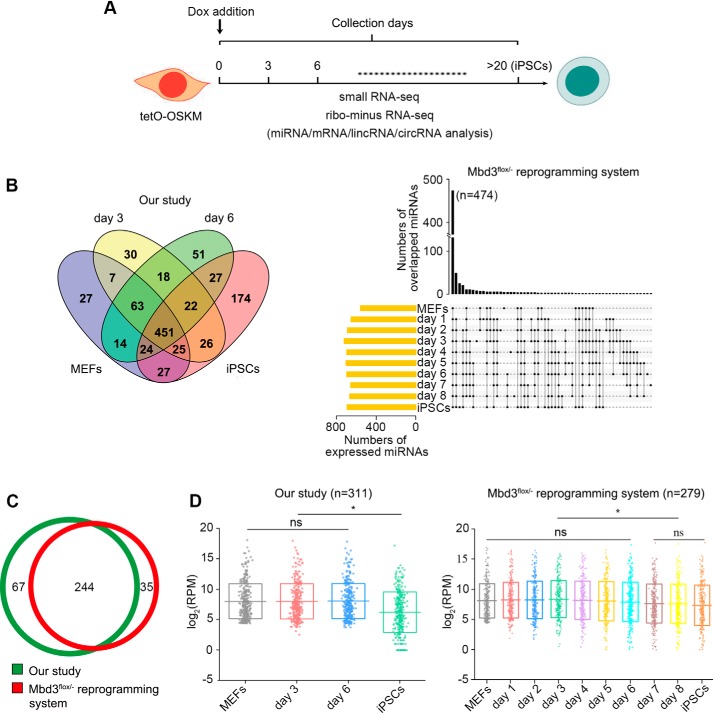
Figure 1.
Profile of miRNAs abundance during reprogramming. A, schematics of iPSCs reprogramming indicating the time points at which samples were collected for library preparations. B, overlap of miRNAs expressed in different reprogramming stages and fully reprogrammed iPSCs. C, highly-expressed miRNAs in MEFs. Only the top 50% abundant and RPM > 20 miRNAs were selected. 244 miRNAs were overlapped between the two reprogramming systems. D, expression patterns of the MEF-high miRNAs over the course of reprogramming and in iPSCs. Each dot represents one MEF-high miRNA. The bottom and top of boxes indicate the 25th and 75th percentiles. The horizontal lines stand for the medians. * indicates p < 0.05.

