Figure 1.
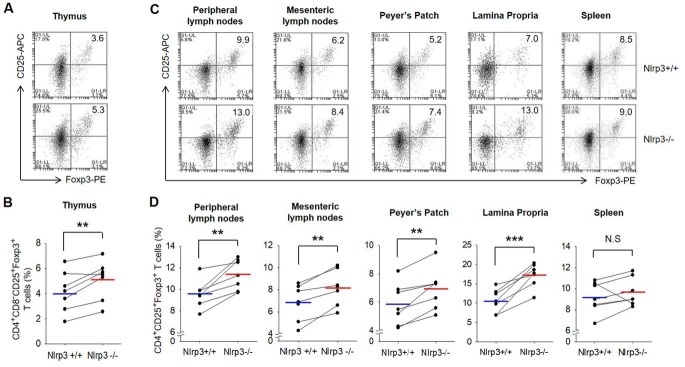
nTregs and pTregs are more present in Nlrp3−/− mice than Nlrp3+/+ mice. A, the population of nTregs in the thymus of Nlrp3+/+ mice and Nlrp3−/− mice. nTregs were stained with mAbs specific for CD4, CD25, Foxp3, and CD8, after depletion of CD8 cells. B, bar graph indicates the percentage of the cells. C, mixture of migratory nTregs and pTregs isolated from peripheral lymph nodes, mesenteric lymph nodes, Peyer's patch, lamina propria, and spleen was stained with mAbs specific for CD4, CD25, and Foxp3. D, summarized results shown as graph. B and D, blue and red lines represent the mean values of Nlrp3+/+ and Nlrp3−/− from seven independent experiments, respectively. **, p < 0.01; ***, p < 0.001; N.S, not significant (Student's two-tailed paired t test). The lines connected with Nlrp3+/+ and Nlrp3−/− indicate littermates (n = 7).

