Figure 3.
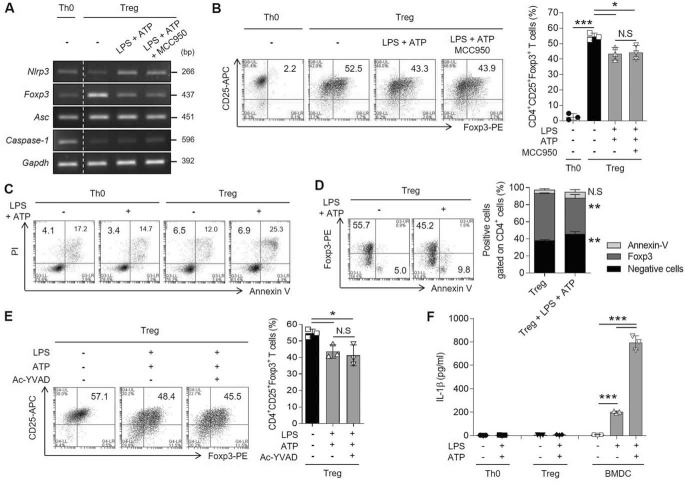
Treg differentiation is disturbed by NLRP3 without inflammasome activation. During iTreg differentiation, the cells were stimulated with LPS for 24 h, followed by pretreatment with MCC950 (10 μm) for 1 h, before ATP (5 mm) treatment for 6 h. A, the mRNA expression of inflammasome components (Nlrp3, Asc, and caspase-1), as well as Foxp3, was detected in iTregs. B, the population of CD25+Foxp3+ T cells gated on CD4+ T cells as in (A). Bar graph represents the percentage of plots. C, the population of pyroptotic cells was assessed with both PI and annexin V staining in CD4+ T cells. Both Th0 and iTreg cells were treated with ATP in the presence of LPS as in (A). PI+/annexin V− cells describe as the pyroptotic cells; PI+/annexin V+ cells indicate the apoptotic cells. D, Foxp3 and annexin V were detected in live iTregs as in (A). Double negative cells, Foxp3+CD4+ cells, or annexin V+CD4+ cells were quantified in bar graph. E, the population of CD25+Foxp3+CD4+ T cells was observed. The cells were treated with Ac-YVAD-CHO (10 μm) instead of MCC950 according to the culture method described in (A). F, secretory level of IL-1β in both Th0 and iTregs stimulated with LPS and ATP was confirmed by ELISA. Label of BMDCs is a control group about the stimulation of NLRP3 inflammasome activation. Data are representative of three independent experiments (n = 3). The results are represented as mean ± S.D. Statistics was significance by Student's two-tailed unpaired t test (B, D, E) or one-way ANOVA (F). *, p < 0.05; **, p < 0.01; ***, p < 0.001; N.S, not significant.

