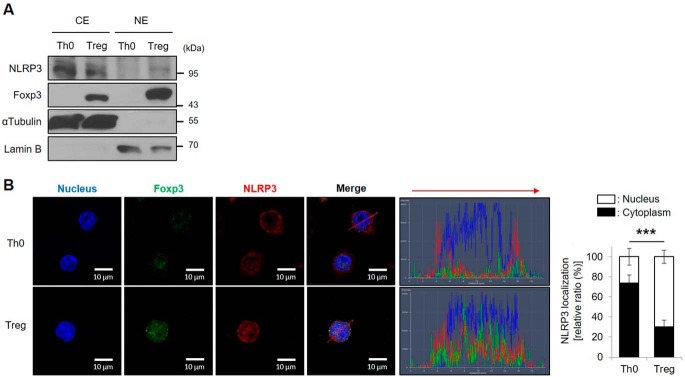
Figure 4.
NLRP3 locates in the nucleus of Tregs. A, the cytoplasmic and nuclear protein levels of NLRP3 and Foxp3 were detected in either Th0 or iTregs after cytoplasmic/nuclear fractionation. αTubulin and lamin B were used as markers of cytoplasm and nucleus, respectively. B, immunofluorescence images of Foxp3 (green) and NLRP3 (red) were assessed in WT CD4+ T cells, after TCR stimulation for Th0 cells, or differentiation by TGF-β and IL-2 for 72 h in the presence of TCR stimulation for iTregs. DNA-binding dye DAPI is used for staining the nuclei (blue), and the scale bar is 5 μm. Four images within each field were collected at 630× magnification. Histogram shows the fluorescence intensity corresponding to the red arrow matched the direction. Line colors match with fluorescence colors. Data are representative of independent experiments (n = 4). Bar graph indicates the percentage of NLRP3 localization in either cytoplasm or nucleus of Th0 and Tregs. The results are represented as mean ± S.D. of six cells. Statistics was significance by Student's two-tailed unpaired t test. ***, p < 0.001.

