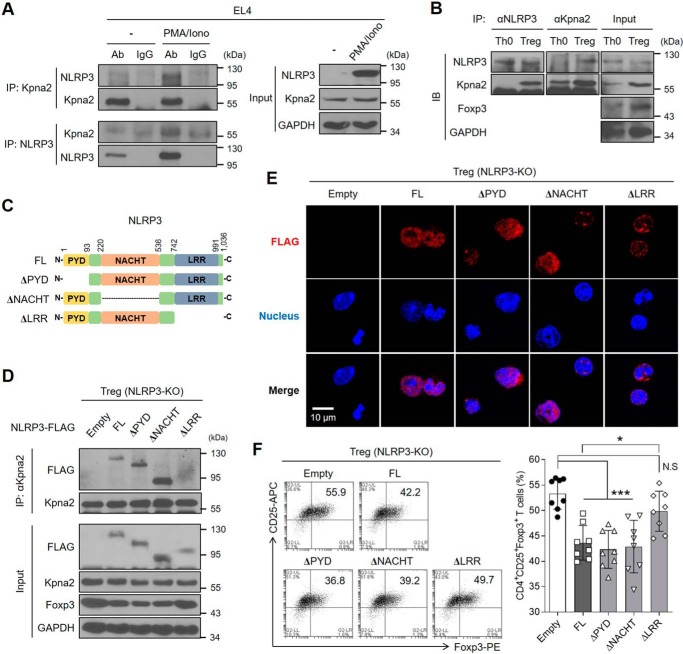
Figure 5.
NLRP3 interacts with Kpna2 to translocate into the nucleus of Tregs. A, EL4 cells were stimulated with PMA (50 ng/ml) and ionomycin (1 μg/ml) for 24 h, after which the cells were lysed and cellular proteins were extracted. Afterward, the protein fraction was immunoprecipitated with either rabbit anti-Kpna2 or mouse anti-NLRP3, followed by the immunoblot assay. Immunoglobulins are used as normal controls. B, either Th0 or iTregs was overexpressed with NLRP3, were subjected to the immunoprecipitation assay of NLRP3 and Kpna2, followed by immunoblot assay with mAbs for NLRP3 or Kpna2. C, schematic diagram of the structures of full-length or truncated mutants of NLRP3. D, iTregs isolated from Nlrp3-KO mice were transduced with empty vector, 3×FLAG-NLRP3 or truncated mutants (ΔPYD, ΔNACHT, ΔLRR). Cells were performed by immunoblot assay of FLAG and Kpna2 after immunoprecipitation with anti-Kpna2. E, immunofluorescence imaging of FLAG-tagged (red) NLRP3 was observed in iTregs after overexpression of either NLRP3 full-length or each domain mutant. Nuclei of iTregs were stained as blue. The object glass lens was used at 40× for amplifying the cells, and the scale bar represents 20 μm. F, the populations of iTregs overexpressed by either NLRP3 or each mutant form were detected by flow cytometry. Bar graph represents the percentage of plots. *, p < 0.05; ***, p < 0.001; N.S, not significant (one-way ANOVA). Data (A–E) are representative of two independent experiments (n = 2) and data (F) are representative of eight independent experiments (n = 8), as mean ± S.D.

