Figure 4.
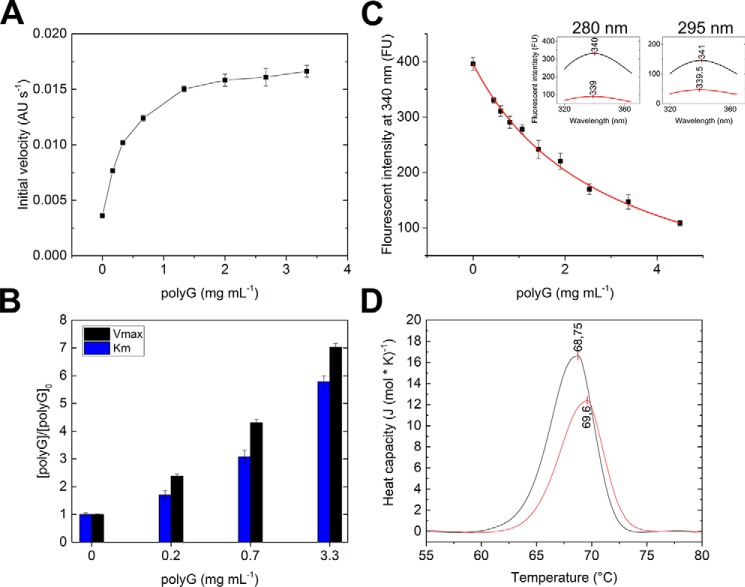
BcelPL6 activation by polyG. A, initial velocity of 50 nm BcelPL6 degrading 3 mg ml−1 alginate in the presence of 0–3.3 mg ml−1 polyG. B, influence of polyG on Km (blue) and Vmax (black) for alginate degradation normalized to values without polyG. C, fluorescence intensity of BcelPL6 with 0–4.5 mg ml−1 polyG. The red line is the fitted binding function. Insets are emission scans of BcelPL6 without (black) and with (red) 4.5 mg ml−1 polyG and excitation at 280 nm (left) and 295 nm (right). The vertical red line on scans indicate the fluorescence maximum wavelength. D, DSC of BcelPL6 with 5 mg ml−1 polyG (red) and without (black). Vertical red lines indicate Tm.

