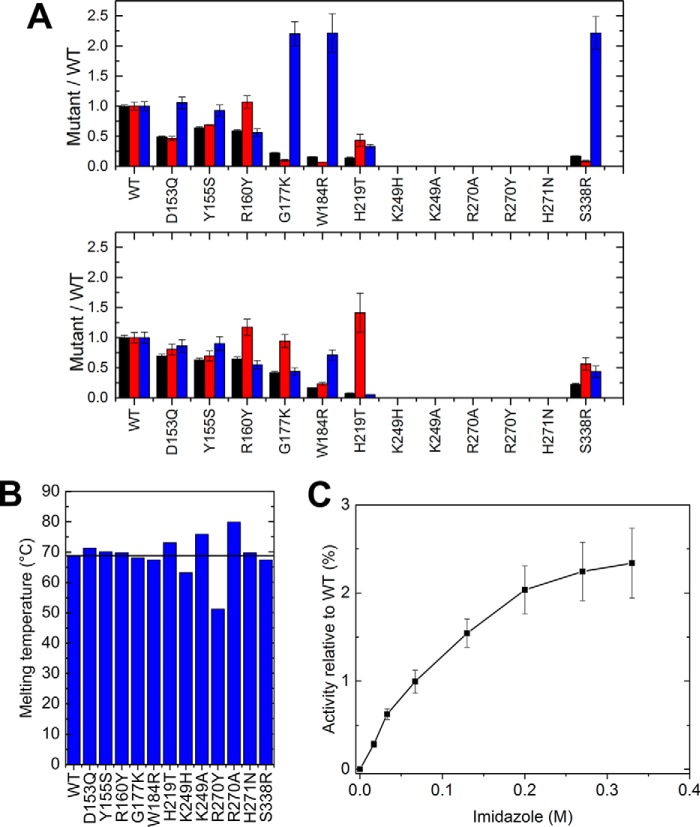
Figure 8.
Characterization of BcelPL6 mutant enzymes. A, kinetic data of WT and mutants normalized to WT values for A: top, alginate; bottom, polyM. kcat (black), Km (red), and kcat/Km (blue). B, melting temperature of WT and mutants determined by DSC. The black line represents WT melting temperature. C, imidazole rescue of activity of BcelPL6 H271N toward 4 mg ml−1 alginate.

