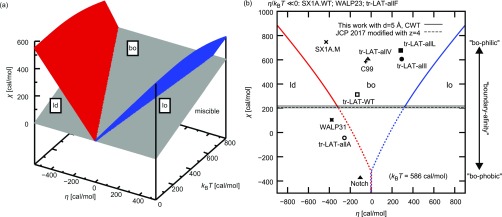
FIG. 12.
(a) The general phase diagram predicted by the Flory-Huggins model indicating the proteins’ affinity to the Ld phase, Lo phase, or phase boundary (bo). At the red (blue) surfaces, the protein concentration of the Ld (Lo) phase is equal to the protein line density at the phase boundary. When χ is small and/or T is high, the miscible phase will form (under gray surface, calculated for N ) (b) The χ and η values obtained with protein monomer simulations are displayed on the phase diagram at T = 295 K. The black solid and black dashed lines show the χ value obtained from the current CWT result from lipid-only simulation and one that can be obtained in spirit of our previous work,24 respectively. As discussed in the main text, the deviation of χ obtained with protein monomer simulation from that obtained with a lipid-only simulation (black lines) can be thought of the protein’s affinity to the boundary. The gray line corresponds to the gray surface in panel (a).

