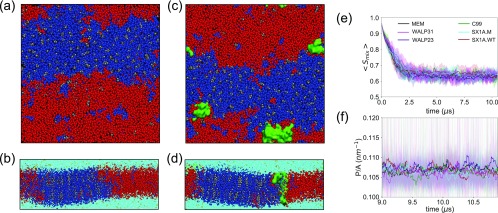
FIG. 3.
Snapshots of (a) top and (b) side views of final configurations of a membrane system (MEM) and snapshots of (c) top and (d) side views of a membrane protein (C99) system. Systems are colored with DPPC (blue), DIPC (red), CHOL (gray), water (turquoise), NaCl (yellow), and proteins (green). Time evolutions of (e) binary mixing entropy [Smix = −p1 log2(p1) − p2 log2(p2)], where p1 and p2 are contact probabilities between similar types of lipids and dissimilar types of lipids and (f) ratio of domain interface perimeter to membrane area (P/A) in last 2 µs of each simulation, where stable interfaces have formed showing averages (thick lines) and standard deviations (shaded). The time series are smoothed by performing running average over a 25 ns window. Simulated systems are color-coded and designated in the following manner. The membrane only system: black (MEM), C99 in membrane: green (C99), SX1AWildtype in membrane: brown (SX1A.WT), SX1AMutant in membrane: cyan (SX1A.M), WALP23 in membrane: indigo (WALP23), and WALP31 in membrane: magenta (WALP31) (see Table S2 for further details).

