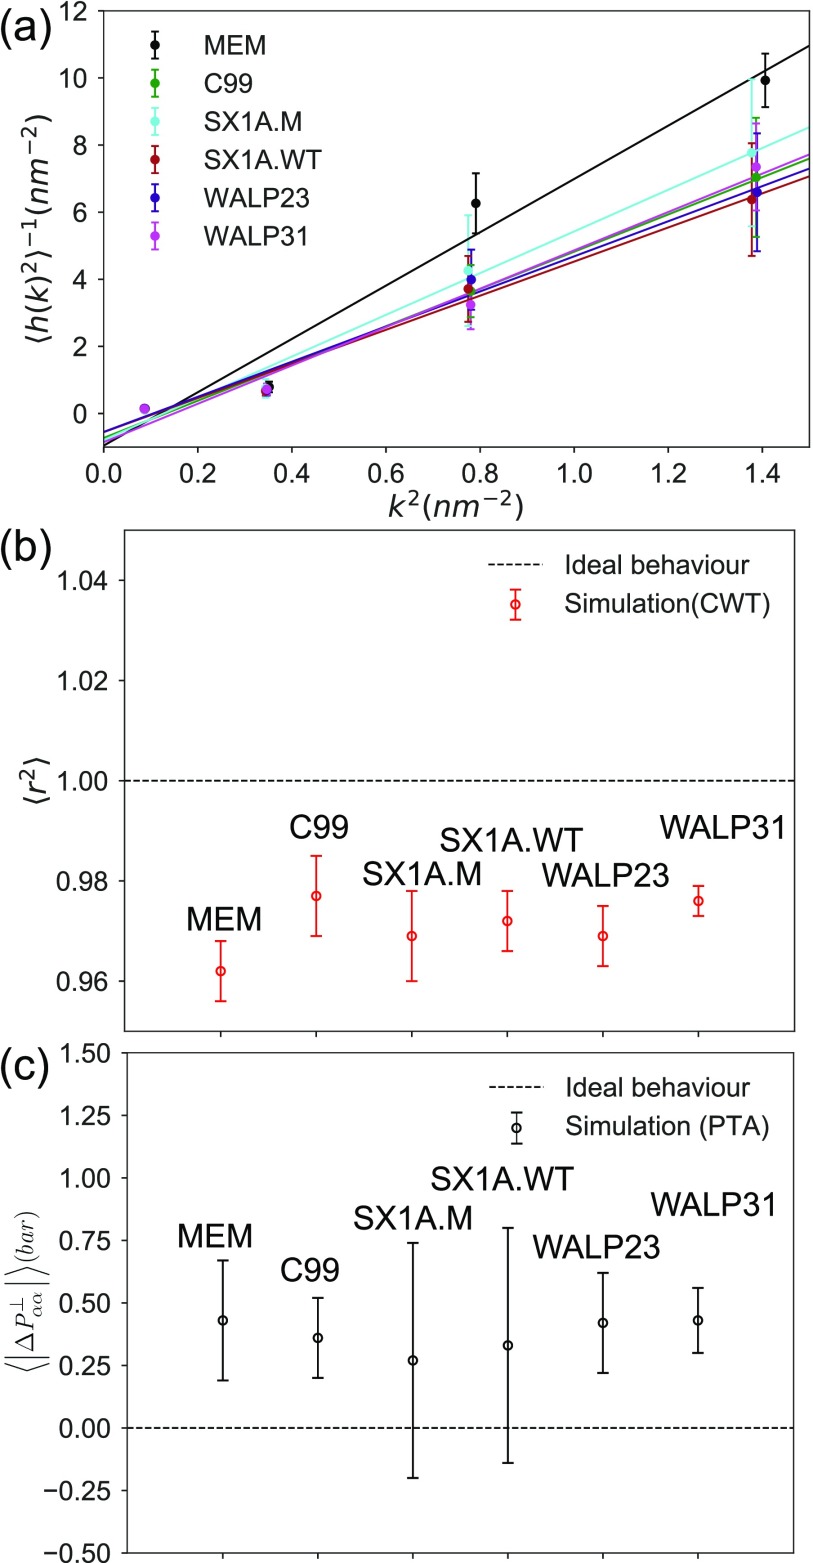
FIG. 8.
(a) Inverse average power spectra of interface height fluctuations as a function of the square of wave the number (k2). (b) Mean-squared Pearson correlation coefficient in vs k2 averaged over replicates (). (c) Absolute difference between the pressure tensors in the two perpendicular dimensions to the domain interface averaged over replicates .

