. 2018 Jun 25;35(2):141–154. doi: 10.5511/plantbiotechnology.18.0427a

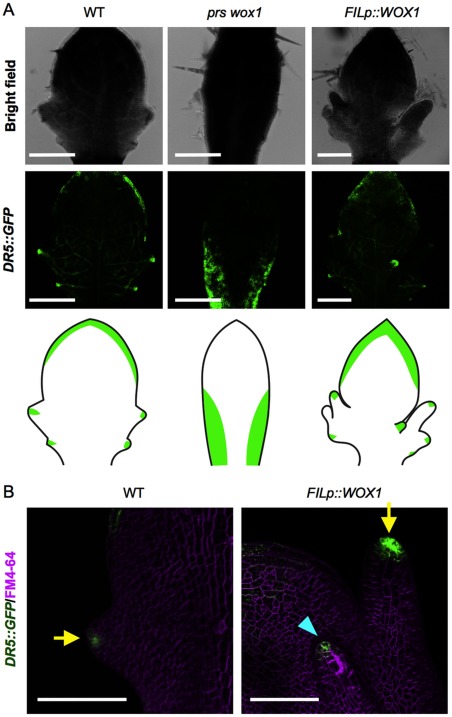
Figure 3. DR5::GFP fluorescent pattern in prs wox1 and the FILp::WOX1 plants. (A) Confocal laser scanning microscope images of developing leaves. The bottom columns show the leaf shape and the GFP pattern in the individual lines. (B) The GFP spots on a growing tip. The arrows indicate the marginal tip, and the arrow head indicates an abnormal abaxial tip. Scale bars, 200 µm (A), 100 µm (B).

Figure 3. DR5::GFP fluorescent pattern in prs wox1 and the FILp::WOX1 plants. (A) Confocal laser scanning microscope images of developing leaves. The bottom columns show the leaf shape and the GFP pattern in the individual lines. (B) The GFP spots on a growing tip. The arrows indicate the marginal tip, and the arrow head indicates an abnormal abaxial tip. Scale bars, 200 µm (A), 100 µm (B).