. 2018 Jun 25;35(2):141–154. doi: 10.5511/plantbiotechnology.18.0427a

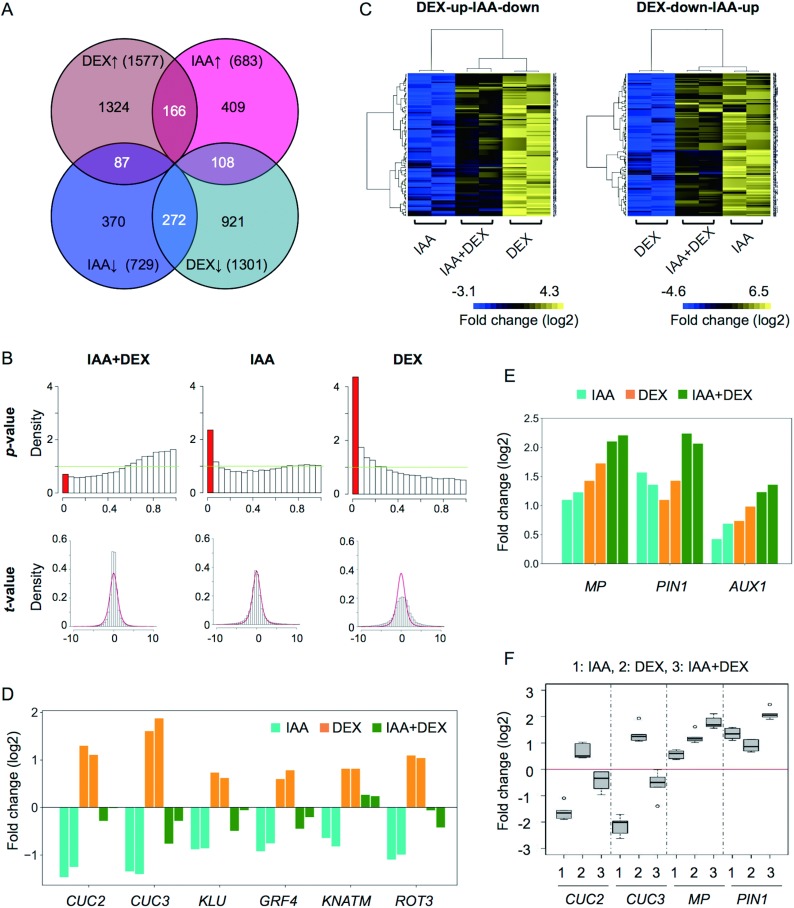
Figure 5. Genes altered in the 35Sp::WOX1-GR treated with DEX and IAA. (A) Venn diagram illustrating the numbers of genes upregulated (upward-pointing arrow) and downregulated (downward-pointing arrow) with or without DEX and IAA. (B) Histograms showing the distributions of calculated t-values and p-values for the linear model’s analysis of the interaction between DEX and IAA. See Materials and Methods for details. (C) Heat maps of fold changes in the expression levels of DEX-up-IAA-down and DEX-down-IAA-up genes compared with the mock treatment. Expression levels of DEX-up-IAA-down genes treated with IAA+DEX were greater than with IAA alone and lower than with DEX alone (left), while those of DEX-down-IAA-up genes treated with IAA+DEX were lower than with IAA alone and greater than with DEX alone (right). Data from different probes for a single gene are shown in different rows in the heat map. (D) Log2FCs in the expression levels of the DEX-up-IAA-down genes involved in shoot meristem and leaf development in comparison with the mock treatment. Two bars of the same color represent the results of two independent lines. (E) Log2FCs in the expression levels of MP, PIN1 and AUX1 in comparison with the mock treatment. Two bars of the same color represent the results of two independent lines. (F) Boxplots showing the results of the RT-qPCR analysis of CUC2, CUC3, MP and PIN1. Data were normalized by the ACT2 expression level.

Figure 5. Genes altered in the 35Sp::WOX1-GR treated with DEX and IAA. (A) Venn diagram illustrating the numbers of genes upregulated (upward-pointing arrow) and downregulated (downward-pointing arrow) with or without DEX and IAA. (B) Histograms showing the distributions of calculated t-values and p-values for the linear model’s analysis of the interaction between DEX and IAA. See Materials and Methods for details. (C) Heat maps of fold changes in the expression levels of DEX-up-IAA-down and DEX-down-IAA-up genes compared with the mock treatment. Expression levels of DEX-up-IAA-down genes treated with IAA+DEX were greater than with IAA alone and lower than with DEX alone (left), while those of DEX-down-IAA-up genes treated with IAA+DEX were lower than with IAA alone and greater than with DEX alone (right). Data from different probes for a single gene are shown in different rows in the heat map. (D) Log2FCs in the expression levels of the DEX-up-IAA-down genes involved in shoot meristem and leaf development in comparison with the mock treatment. Two bars of the same color represent the results of two independent lines. (E) Log2FCs in the expression levels of MP, PIN1 and AUX1 in comparison with the mock treatment. Two bars of the same color represent the results of two independent lines. (F) Boxplots showing the results of the RT-qPCR analysis of CUC2, CUC3, MP and PIN1. Data were normalized by the ACT2 expression level.