. 2018 Jun 25;35(2):155–159. doi: 10.5511/plantbiotechnology.18.0312a

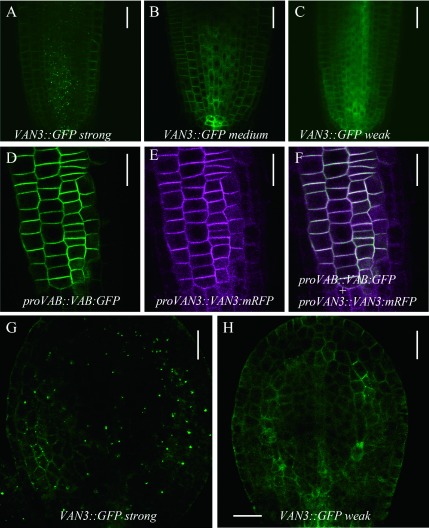
Figure 3. Subcellular localization analysis of different expression levels of VAN3. (A–C) Functional VAN3-GFP localization in root tips at different expression levels: strong expression lines (A), medium expression lines (B), and weak expression lines (C). (D–F) Colocalization analysis of VAN3-mRFP and VAB-GFP in van3vab mutants. GFP image (D), RFP image (E), and merged image (F). (G and H) Functional VAN3-GFP localization in cotyledons. Subcellular localization in strong expression lines (G) and weak expression lines (H). VAN3-GFP and VAB-GFP were excited with 488 nm laser at 15% and 20% of laser power, respectively. VAN3-mRFP was excited by 541 nm laser with 40% power. Images are taken by Olympus FV1000. Scale bars: 30 µm (A–C), 20 µm (D–H).

Figure 3. Subcellular localization analysis of different expression levels of VAN3. (A–C) Functional VAN3-GFP localization in root tips at different expression levels: strong expression lines (A), medium expression lines (B), and weak expression lines (C). (D–F) Colocalization analysis of VAN3-mRFP and VAB-GFP in van3vab mutants. GFP image (D), RFP image (E), and merged image (F). (G and H) Functional VAN3-GFP localization in cotyledons. Subcellular localization in strong expression lines (G) and weak expression lines (H). VAN3-GFP and VAB-GFP were excited with 488 nm laser at 15% and 20% of laser power, respectively. VAN3-mRFP was excited by 541 nm laser with 40% power. Images are taken by Olympus FV1000. Scale bars: 30 µm (A–C), 20 µm (D–H).