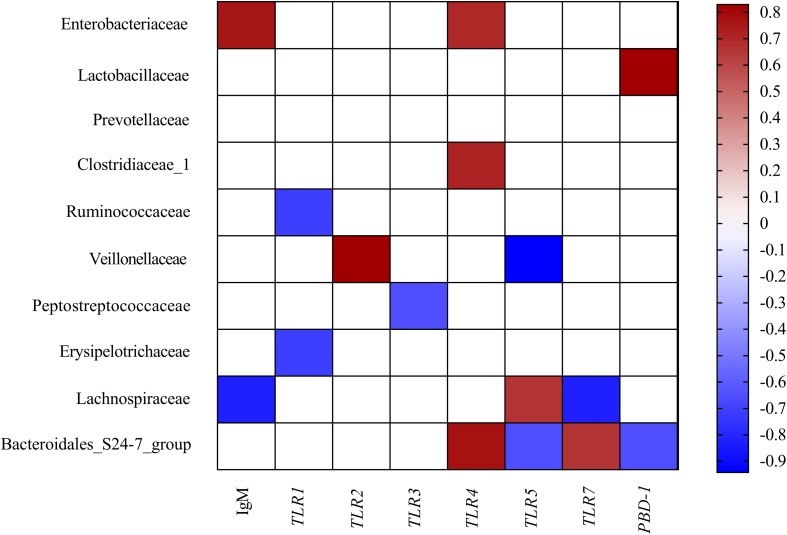
FIGURE 3.
Correlation analysis between colonic microbial composition (relative abundance of family higher than 0.1%) and serum immunity and genes related to gut immunity that were significantly affected by FF treatment in the colon of pigs. The color represents a significant correlation (P < 0.05), and the intensity of the colors represents the degree of association. Red represents significant positive correlation and blue represents significantly negative correlation (n = 6).

