Figure 1.
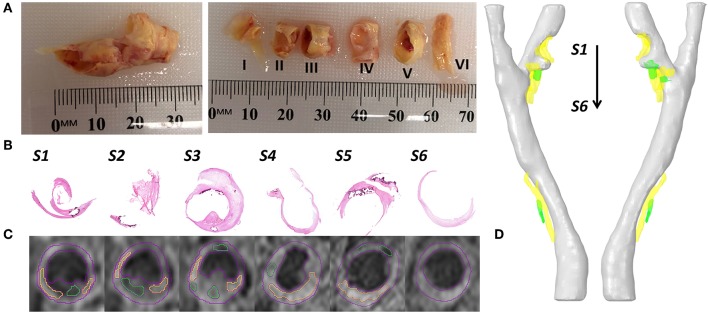
Examples of collected data and data processing. (A) The collected carotid plaque tissue sample (left) and later the sample was cut into six segments with 3–4 mm thick. (B) The Hematoxylin & Eosin (H & E) staining of 6 slices. (C) At the same position of staining slices, the T1-weighted MR imaging slices with segmented contours (lumen and vessel in red color, lipid in yellow color, and calcification in green color). (D) The reconstructed 3D patient-specific carotid bifurcation, including the geometries of lumen (gray), lipid (yellow) and calcification (green).

