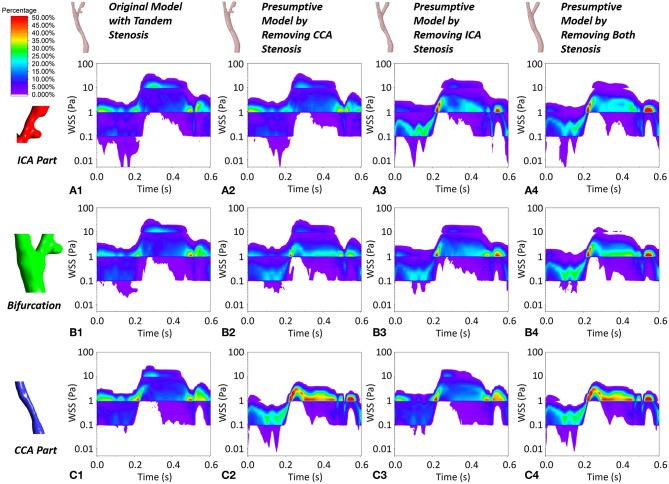
Figure 8.
The contour maps of WSS concentration at local ICA part, local bifurcation part and local CCA part during one cardiac cycle in the four geometric models. (A1–A4) The WSS plot at local ICA part in the four geometric model. (B1–B4) The WSS plot at local bifurcation part in the four geometric model. (C1–C4) The WSS plot at local CCA part in the four geometric model.

