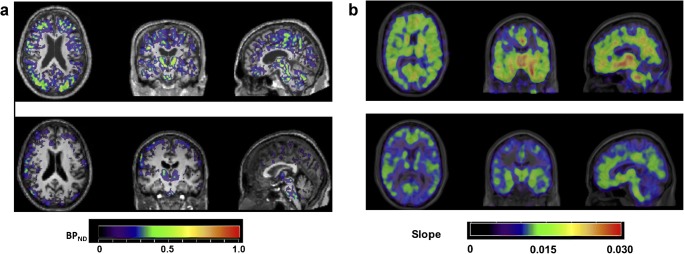
Fig. 4.
a Parametric 11C-(R)-PK11195 PET images of microglial activation in one MCI patient (upper row) and one healthy volunteer (lower row); PET images are displayed on each subject’s respective T1-weighted MRI scan normalised to the SPM5 T1 brain template and the colour bar indicates non-displaceable binding potential (BPND) values. b Parametric 11C-deuterium-L-deprenyl PET images of astrocyte activation in one Aβ-positive MCI patient (upper row) and one healthy volunteer (lower row); PET images are displayed on each subject’s respective T1-weighted MRI scan normalised to the SPM5 T1 brain template and the colour bar indicates modified-reference (cerebellar grey matter) Patlak slope values; the 11C-deuterium-L-deprenyl PET imaging data were kindly provided by Prof. Agneta Nordberg, Karolinska Institutet, Sweden

