Fig. 1.
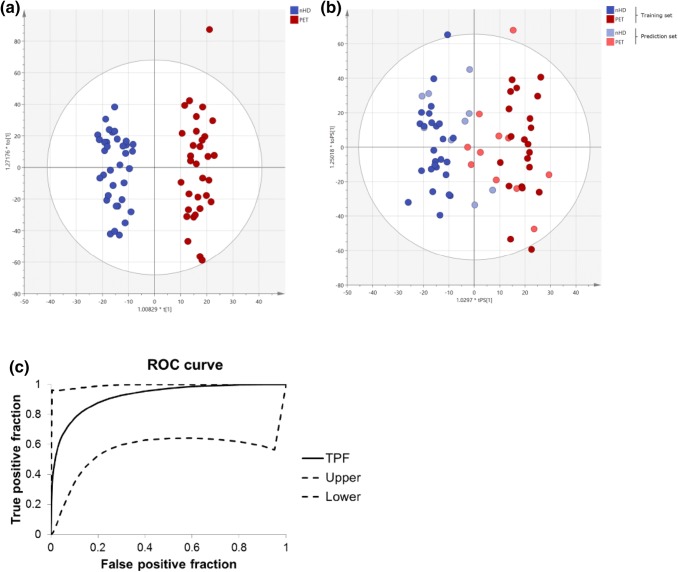
Multivariate analysis based on all detected ions: a OPLS-DA score plot of control (no hypertensive disease, nHD, n = 35) and pre-eclampsia (PET, n = 32) samples for all variables. b OPLS-DA score plot of training and prediction set for control (no hypertensive disease, nHD) and pre-eclampsia (PET) samples for all variables. c Receiver operator characteristic (ROC) curves for all variables. The figure shows the true positive fraction (TPF) with upper and lower 95% confidence intervals. The AUC is 0.922 with a standard error of 0.06

