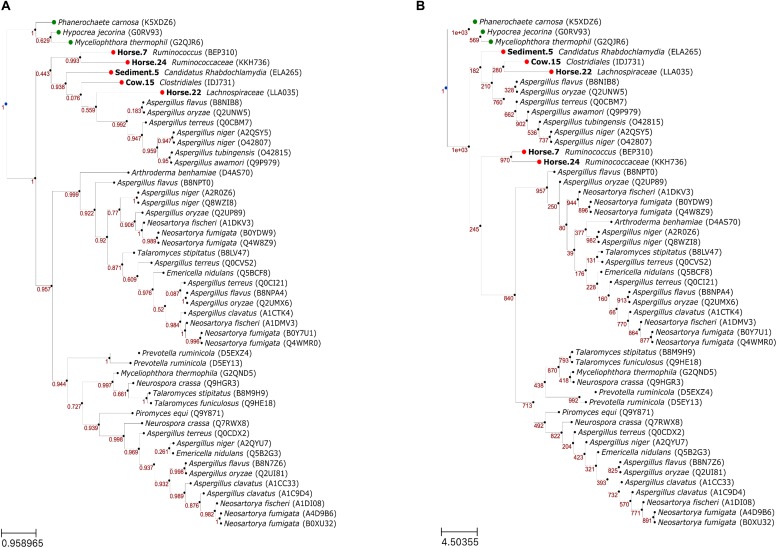
FIGURE 4.
Phylogenetic relationships of feruloyl esterases (FAEs) predicted in this study (in bold) with reference FAEs, using maximum likelihood (A) and neighbor joining (B) methods. Confidence values in panels (A) and (B) represent Shimodaira–Hasegawa support values (1000 resampling) and bootstrap values (1000 bootstraps), respectively. Leaf nodes in green are the outgroup. Leaf naming is “<species> (<UniProt ID>)” for the reference/outgroup sequences and “<bin id><predicted taxon> (<protein id>)” for the putative sequences.

