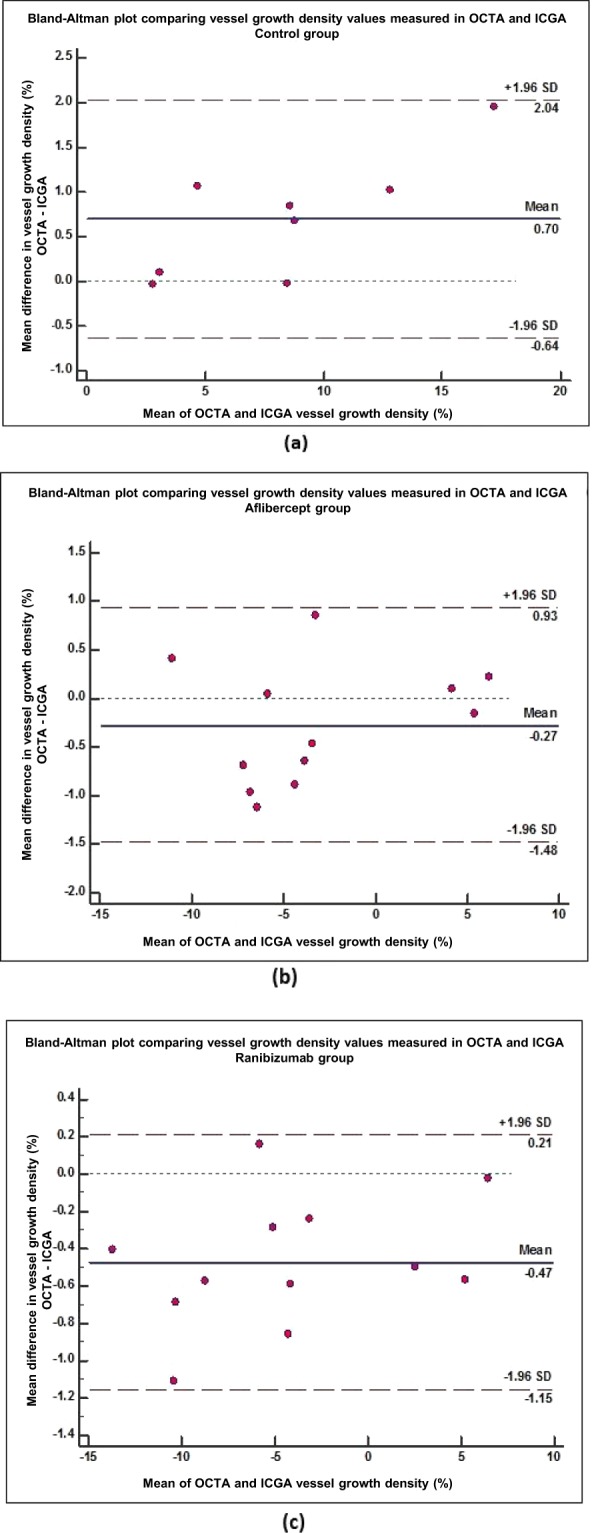
Figure 1.

Bland-Altman comparing vessel growth density (%) measurements computed using ICGA and ASOCTA imaging techniques. Mean difference in vessel growth density measurements between the two imaging modalities (y-axis) are plotted against the average measurements taken with the two methods (x-axis). This is compared for each group of drug administration (a) Saline control group; Mean difference = 0.70% (95% CI: 0.13 to 1.270) (b) Aflibercept treatment group; Mean difference = −0.27% (95% CI: −0.67 to 0.12%) and (c) Ranibizumab treatment group; Mean difference = −0.47% (95% CI: −0.69 to −0.25%).
