Figure 4.
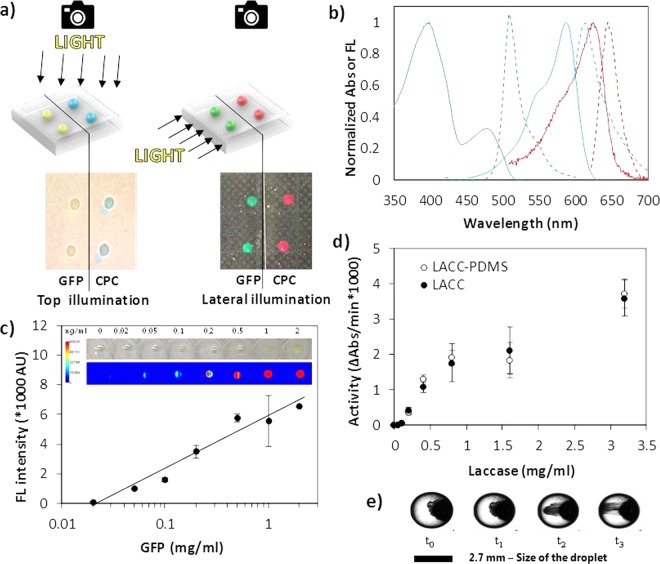
Characterization of fluorescent proteins, enzymes, and nanoparticles included as droplets in PDMS. (a) Fluorescence of the included biomolecules was visible upon lateral illumination. (b) In situ measurements of the absorbance (continuous line) and fluorescence (dashed line) emission spectra of GFP (green), mCherry (blue), CPC (red) and included as droplets in PDMS. (c) Linear concentration-dependent fluorescence emission of GFP as droplets in PDMS. In the inset, a photographic image and a false colouring based on fluorescence of the material. (d) Concentration-dependent activity of laccase included in PDMS (empty dots) and of the control solution (filled dots). (e) Migration of nanoparticle aggregates in aqueous solution as droplets when exposed to an external magnetic field (magnet on the left) and visualized by optical microscopy over time (droplet volume: 10 µl, = 2.7 mm, total time = 30 s).

