
Figure 1.
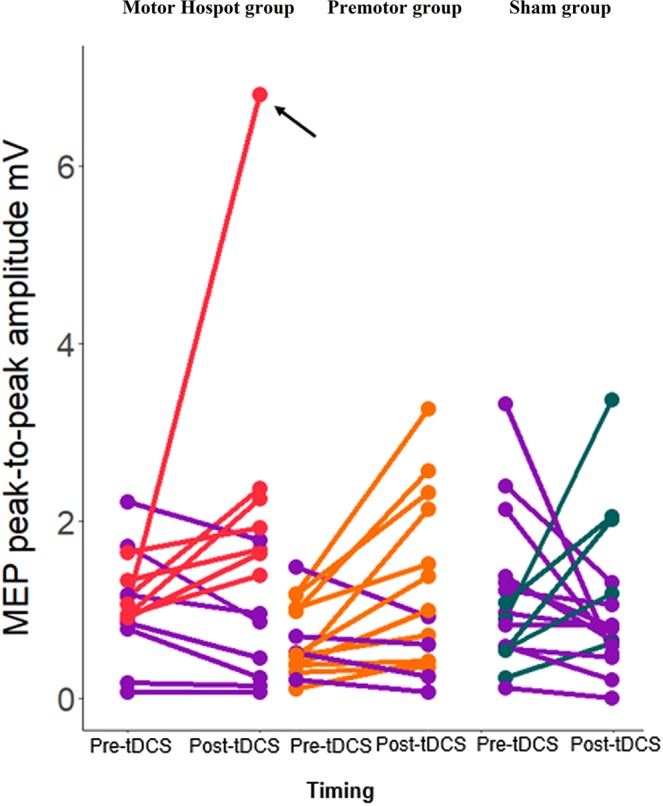
Individual changes in MEP amplitude over time. The dot pairs reflect MEP amplitude pre and post-tDCS for each participant in each of the 3 groups. Participants who showed a decrease in MEP between pre and post-tDCS are displayed in purple. *In the Motor Hotspot group, one participant presented a very strong effect post-tDCS. After running an outlier detection, this participant was removed from the rest of the analyses (indicated by the black arrow). M1: primary motor area, MEP: motor evoked potential, mV: millivolts, PMd: dorsal premotor cortex, tDCS: transcranial direct current stimulation.