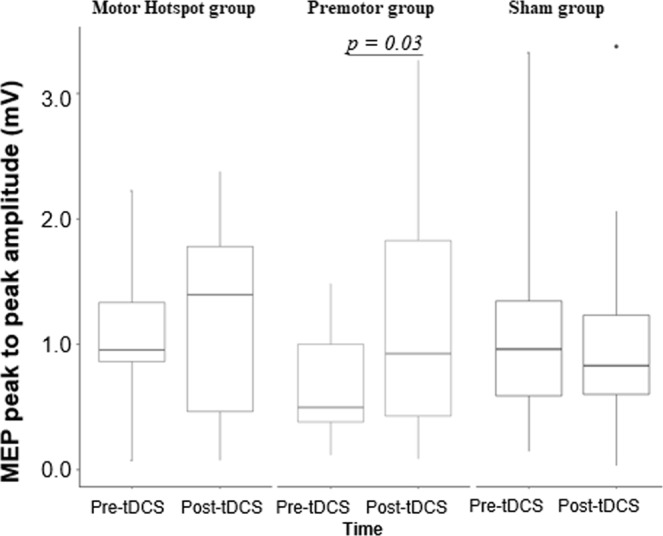
Figure 2.

Changes in MEP amplitude for each group across time. Box-and-whisker plots of MEP amplitude per group over time (pre/post-tDCS). The center line represents the median value, the lower bound of the box represents the 25th percentile, the upper bound of the box the 75th percentile, and the whiskers represent 3 times the interquartile range. Any outliers are indicated by dots. Note that the only statistically significant difference is observed in the Premotor group reflecting an increase of MEP amplitude post-tDCS compared to pre-tDCS. The p-values refer to the statistically significant post-hoc contrasts. M1: primary motor area, MEP: motor evoked potential, mV: millivolts; PMd: dorsal premotor cortex, tDCS: transcranial direct current stimulation.
