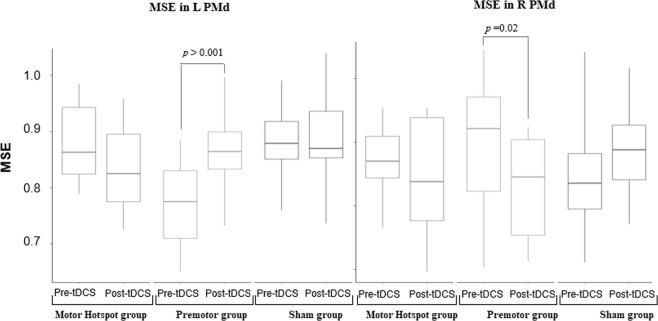
Figure 3.
Changes in MSE across groups. Box-and-whisker plots of the MSE per group over time (pre/post-tDCS) in the left PMd ROI (in the left panel) and in the right PMd ROI (in the right panel). The center line represents the median value, the lower bound of the box represents the 25th percentile, the upper bound of the box the 75th percentile, and the whiskers represent 3 times the interquartile range. Any outliers are indicated by dots. The p-values refer to the statistically significant post-hoc contrasts. L: left, M1: primary motor area, MSE: multiscale entropy, PMd: dorsal premotor cortex, R: right, tDCS: transcranial direct current stimulation.

