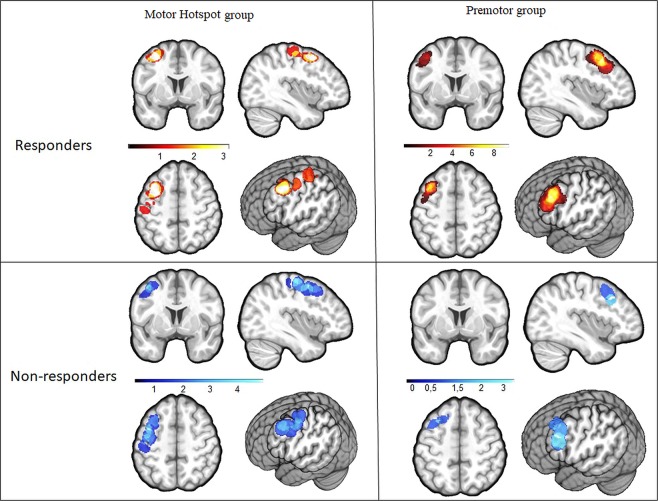
Figure 5.
Heat map of the stimulation site between responders and non-responders in the Motor Hotspot and Premotor groups. This figure displays the location of the anatomical stimulation sites in the participants allocated to the Motor Hotspot group (n = 14) for the 7 responders (hot heat map) and the 7 non-responders (cool heat map), and to the Premotor group (n = 15) for the 11 responders and the 4 non-responders. The majority of the responders in both Motor Hotspot and Premotor groups received stimulation over the same spot within the PMd anatomical boundaries (see also Supplementary Fig. 5).

