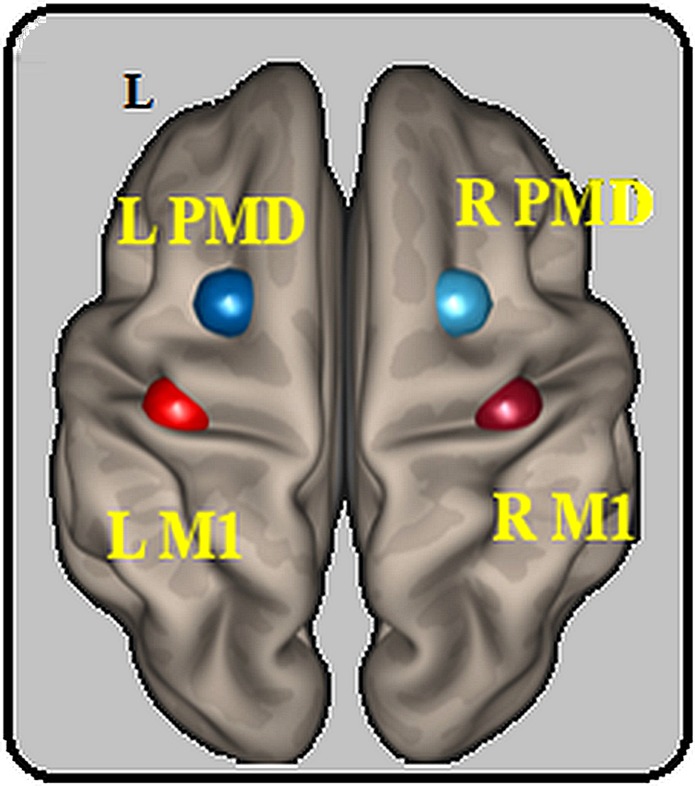
Figure 7.

Location of the regions of interest. Location of the 4 ROIs based on the meta-analysis from Hardwick and collaborators38. Each ROI was defined as a sphere with a radius of 10 mm around the reported peak coordinates for each region. These were: left M1 (x = −38, y = −24, z = 56), right M1 (x = 38, y = −24, z = 56), left PMd (x = −26, y = 2, z = 60), right PMd (x = 26, y = 2, z = 60). L: left, M1: primary motor area, PMd: dorsal premotor cortex, R: right, ROI: region of interest.
