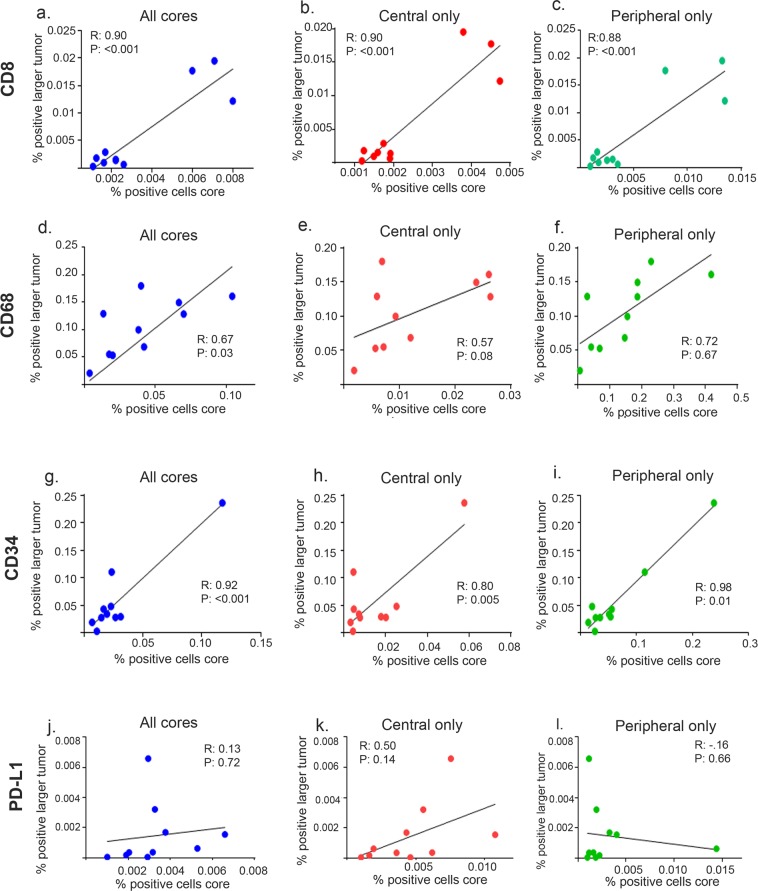
Figure 3.
Correlation between marker positive cell counts in large samples versus core biopsies. Correlation between number of positive-stained cells for CD8 (a–c), CD68 (d–f), CD34 (g–i), and PD-L1 (j–l) in large tissue versus cores. CD8+ correlations between large tumor samples and (a) all core biopsies, (b) central core biopsies only, and (c) peripheral core biopsies only. CD68+ correlation for (d) all core biopsies, (e) central core biopsies only, and (f) peripheral core biopsies only. CD34+ correlations for (g) all core biopsies, (h) central core biopsies only, and (i) peripheral core biopsies only. PD-L1+ correlations for (j) all core biopsies, (k) central core biopsies only, and (l) peripheral core biopsies only. Pearson correlation coefficient (R) and P values for each correlation analysis are shown in insets.

