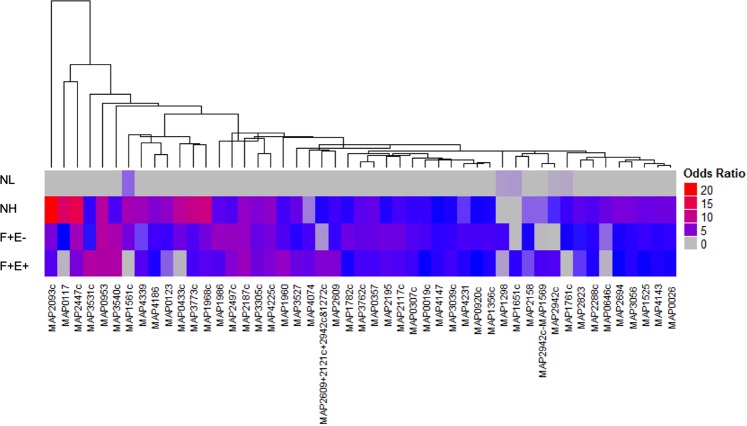
Figure 2.
Patterns of serum reactivity to 49 MAP proteins with their odds ratios. Odd ratios differed significantly compared with that in the NL group. The heatmap shows reactivity from 4 groups to each of the 49 proteins. Each column represents one protein, odds ratios are visualized as a color spectrum. The heatmap was generated using the ComplexHeatmap package in R. The clustering was performed using the pvclust package with multiscale bootstrap resampling. Arguments passed to the pvclust command for the hierarchical clustering method (method.hclust) was “median” and for the distance method (method.dist) was “maximum”.

