
Figure 3.
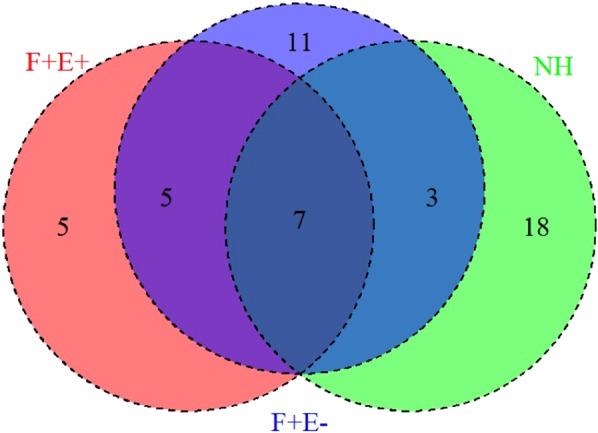
Venn diagram of 49 antigens identified in all three disease groups. The diagram shows antigen hit number distribution of all 3 groups: NH (green), F + E− (blue), and F + E+ (red). The three ellipses show the total number of hits from the 3 groups. Numbers indicate unique antigens identified in each group (non-overlapping areas) and shared antigens among groups (overlapping areas). Thirty four percent of antigens are shared among groups.