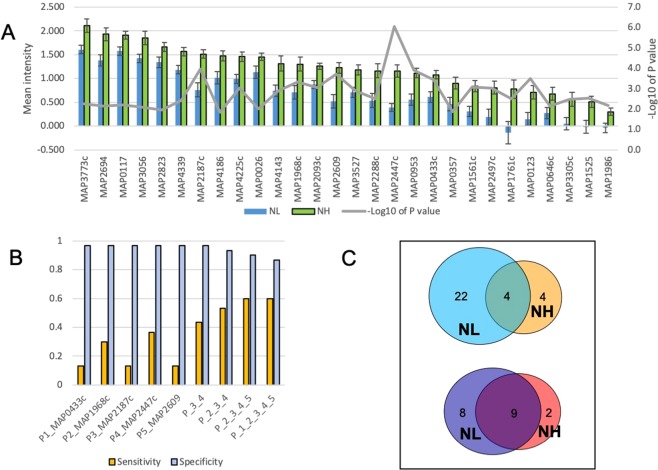
Figure 4.
Antigens identified from the NH group. (A) The mean IgG reactivity to antigens was compared between the NH and NL mean intensity among 28 antigens. Corresponding p value (Wilcoxon test, −log10 of p value) to each antigen is shown in grey line on the secondary y axis. (B) Sensitivity of top 5 proteins at specificity 0.967 and sensitivity/specificity for combined antigens. (C) Different profiles of comparison of infected groups with NL and NH as a reference. Upper: number of significantly reactive proteins identified in F + E− group in comparison with NL (left circle) and NH (right). Bottom: number of significantly reactive proteins identified in F + E+ group in comparison with NL (left circle) and NH (right).

